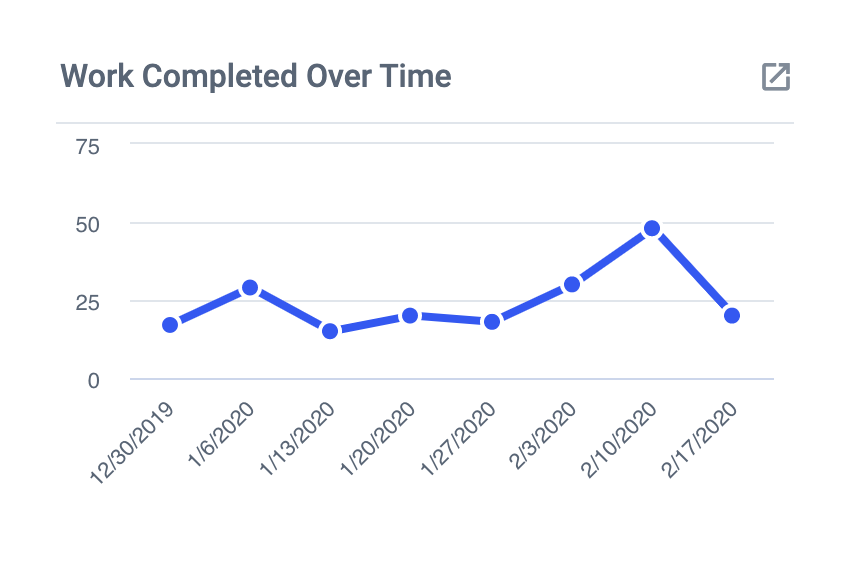
Work Completed Over Time
This historical chart will show you how much work you have completed over a specified period of time. In conjunction with a Work Added Over Time chart, this chart can be used to see if your completed output is aligned with your accumulated workload. This can be useful to identify periods where workload is backed up or help you visualize the work completed from something like a sprint.
To get started, create a Historical Chart for completed Cards.
- When selecting your Completed Lists, ensure you select all Lists where Cards go when they are considered complete.
- At the "Totals" stage, select Cards.
- At the "Filter" stage you can select no filter to show all completed Cards. Alternatively you could select a filter to give you a customized display of completed Cards by a specified criteria. Some examples:
- Member: Show work completed for a specific member or set of members of your team.
- Label: Show work completed by category, as defined by your Labels.
- Custom Fields: Show work completed over time as defined by any of your Custom Fields.
Once completed, you can set the display time frame by opening the calendar window from the bottom right-hand corner of the tile.
- You can use the pre-set time frames from the right-hand side, or you can set your own custom time frame by using the calendar to select your start and end dates.


