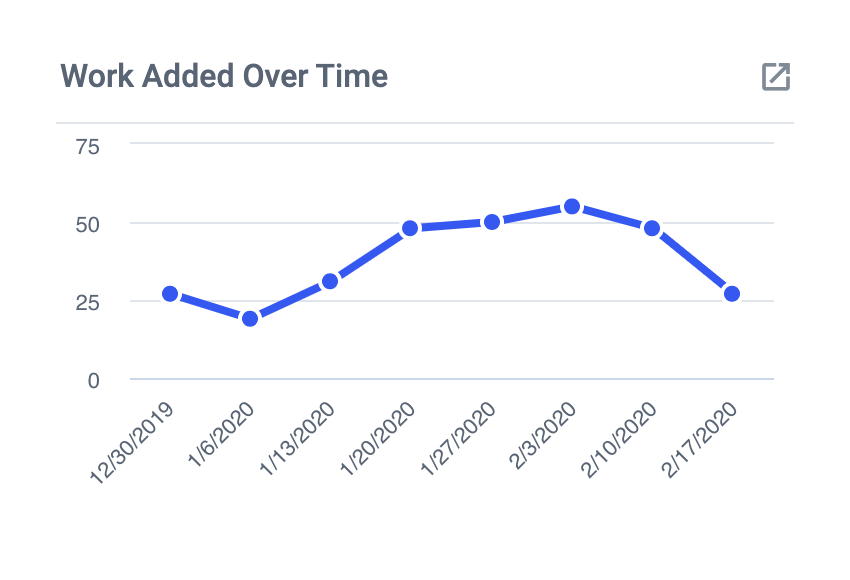
Work Added Over Time
This historical chart will show you how much work has been added to your Board over a specified period of time. This can help you identify trends in workload or to see how your workload is changing over time.
To get started, create a Historical Chart for Cards Added to Board.
- At the "Totals" stage, you would select Cards.
- At the "Filter" stage you can select no filter to show all Cards added to your board. This will show total work added over the time period you select. Alternatively you could select a filter to give you a customized display of work added over time by a specified criteria. Some examples:
- Member: Show work added over time for a specific member or set of members of your team.
- Label: Show work added over time by category, as defined by your Labels.
- Custom Fields: Show work added over time as defined by any of your Custom Fields.
Once completed, you can set the display time frame by opening the calendar window from the bottom right-hand corner of the tile.
- You can use the pre-set time frames from the right-hand side, or you can set your own custom time frame by using the calendar to select your start and end dates.


