Wins Over Time
These charts will show you how many leads you won and lost over time. Instead of looking at the value of the wins, it will simply show you the volume of each you have achieved.
This chart assumes you are using a List(s) to identify your won/lost leads. See Sales Teams Recommendations.
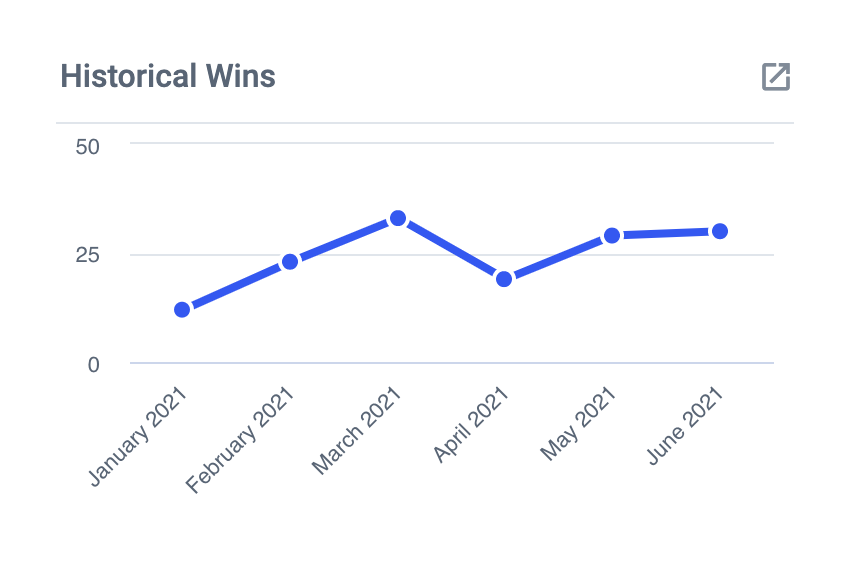 Won/Lost Leads Over Time
To get started, create a Historical Chart for open Cards.
- At the filter stage, you would want to apply a filter for List and select your Won or Lost List.
Once completed you can set the display time frame by opening the calendar window from the bottom right-hand corner of the tile.
- You can use the pre-set time frames from the right hand side, or you can set your own custom time frame by using the calendar to set your start and end dates.
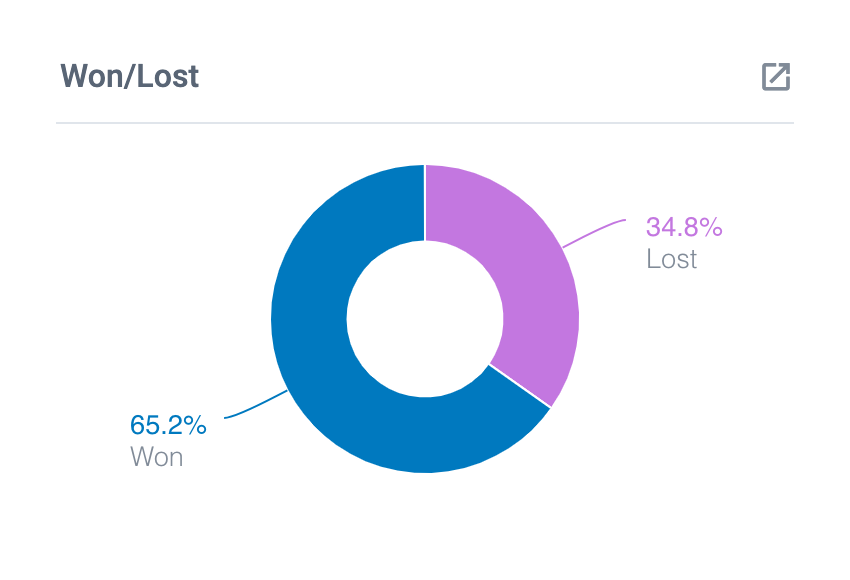
Won/Lost Lead Totals
To get started, create a Pie or Bar Chart for open Cards.
- At the "Data Breakdown" stage, you would select List.
- At the "Filter Stage" you would want to apply a filter for List. Here you would select both your Won and Lost Lists.


