This chart will show you the value of your current sales funnel. This will give you a nice at-a-glace view of what is in the works in your sales funnel.
We recommend using a numeric custom field to track your sales value. See Sales Teams Recommendations.
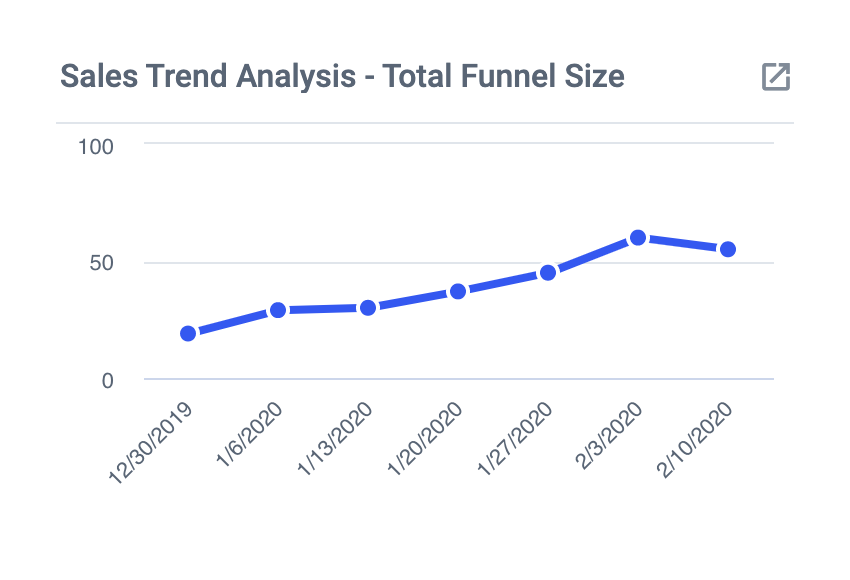
To get started, create a Historical Chart for open Cards.
- At the "Totals" stage, you would select "Sales Value" to generate a sum of the field.
- At the filter stage, you would apply a filter for List. Select the list(s) you use to identify your current sales funnel.
Once completed you can set the display time frame by opening the calendar window from the bottom right-hand corner of the tile.
- You can use the pre-set time frames from the right hand side, or you can set your own custom time frame by using the calendar to set your start and end dates.


