This chart will show you your total anticipated sales for new prospects in your current sales funnel. This will give you a nice at-a-glace view of the potential value of new prospects. Alongside a Total Sales Value Chart, this will allow you to see the value of your newly acquired leads.
We recommend using custom fields to track your sales value . See Sales Teams Recommendations.
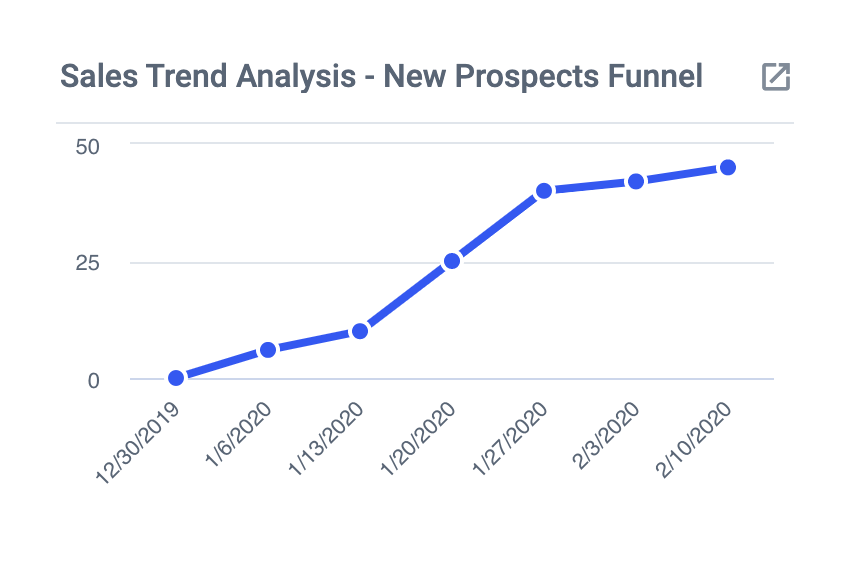
To get started, create a Historical Chart for Cards added to board.
- At the "Totals" stage, you would select "Sales Value" to generate a sum of the field.
- At the filter stage, you would apply a filter for List. Select the List you use to identify your new prospects in your sales funnel.
Once completed, you can set the display time frame from the bottom right-hand side of the tile to something like "Last 7 days" to show only those prospects that are the newest.


