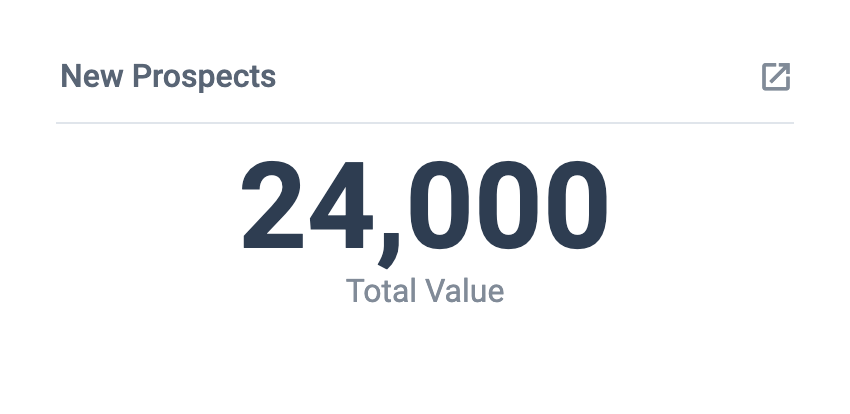
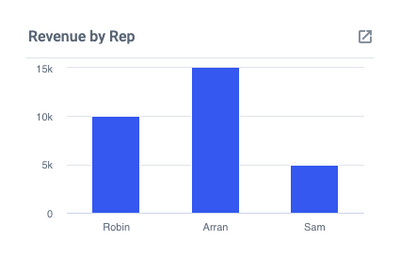
Leads Added - Value
This chart can be very useful to see the value of the new leads being added to your board regularly. By changing the display time period you can review past week's/month's new leads to see how much is being added to your sales funnel.
This chart assumes you are using a numerical custom field to indicate the value of each lead or prospect along with our other Sales Teams Recommendations.

To get started, create a Count or Sum for Cards Added to Board.
- At the "Totals" stage, you would select "Sales Value" to generate a sum of the custom field.
- Should you want to break the data down further you could apply filters at the "Filter" stage to display the following:
- By Source: You would apply a filter for your dropdown custom field, "Source", then select whichever source(s) you would like displayed.
- By Prospect Category: You would apply a filter for your dropdown custom field "Prospect Category" and select which category you would like displayed.
Once completed, you can set the time period to display by using the dropdown menu at the bottom of the tile. To show your newest leads, we recommend displaying all Cards added to your Board in the last 7 days to show only your most recently acquired leads.


