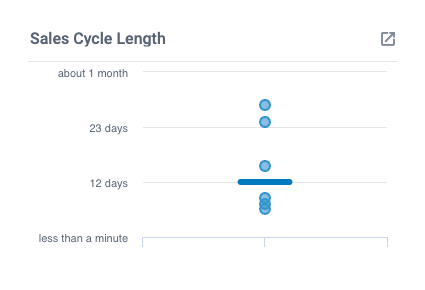
This chart will show you how long it takes your Cards to move through your sales funnel. The chart will also give you the median time to complete so that you can gauge approximately how long your sales cycle lasts from identifying an opportunity to closing a lead. This chart can help you understand how long your sales process takes so that you know how long you can expect customers to be in the sales process. If outliers are present you can use this as an opportunity to investigate and find out why they are stuck to help move the process long.
This chart assumes you are using Lists to identify the different stages of your sales funnel. See Sales Teams Recommendations.
To get started, create a Time to Complete Chart.
- At the "Data Breakdown" stage, select "None" as your grouping option. This will give you a general overview of completion times.
- Your "1st In Progress List" will be the very first List where your Cards are created to ensure we are tracking the total time to complete.
- Your "Done List" will be the final List your Cards end up in once the lead is closed.
Once completed you can set the display time frame by opening the calendar window from the bottom right-hand corner of the tile.
- You can use the pre-set time frames from the right hand side, or you can set your own custom time frame by using the calendar to set your start and end dates.


