The Blue Cat Guide To Trello Daily Email Reports
A visual representation of your data without the proper reporting misses the whole point of improving performance. So, you have created your Trello Boards, Lists, and Cards and mapped out your project management frameworks. But what about measuring and improving your efficiency with reporting?
Trello daily reports allow you to keep track of the tasks that are relevant to your business and focus on the high-priority Cards. If you’re solely counting on Trello for reporting, you’re presented with two options: using Automation or the Email Reports configurator.
However, if you want to keep your workflow straightforward and your reports transparent, using the Blue Cat Reports Power-Up could do the trick for you. In this article, we’ll be examining all your options when it comes to Trello daily reports so that you have everything you need to decide on the best option for your needs.
Try a free trial of Blue Cat Reports!
Trello's easiest to use (and most powerful! 😎) reporting tool
Let’s begin!
We will start with Blue Cat Reports as it is the easiest to set up and has most features. Blue Cat Reports can also be used with both the free version of Trello and their paid tiers. If you want to see how to build reports using the features included in the paid version of Trello you can skip ahead to that 😺
Daily Email Reports - two ways!
Blue Cat Reports has two types of reports it can send you daily. We make use of both of them here at Blue Cat HQ so let me walk you through each of them
Simple email reports - get me a list of Cards!
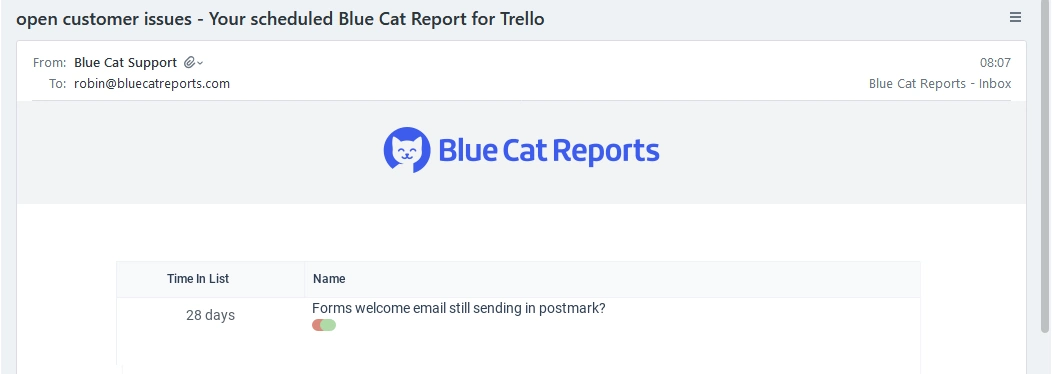
The simplest approach is actually one of the best ways to use daily email reports. Here’s how you can get a list of cards emailed to you or your team every day with Blue Cat:
- Firstly, install Blue Cat Reports on your Board and open the power-up from the button bar at the top of your board.
- Select Create a Quick List and choose the Board you want to see Cards from and select to show Cards or Checklist items.

- You now have a lot of options to filter and show just the cards you want. For example...
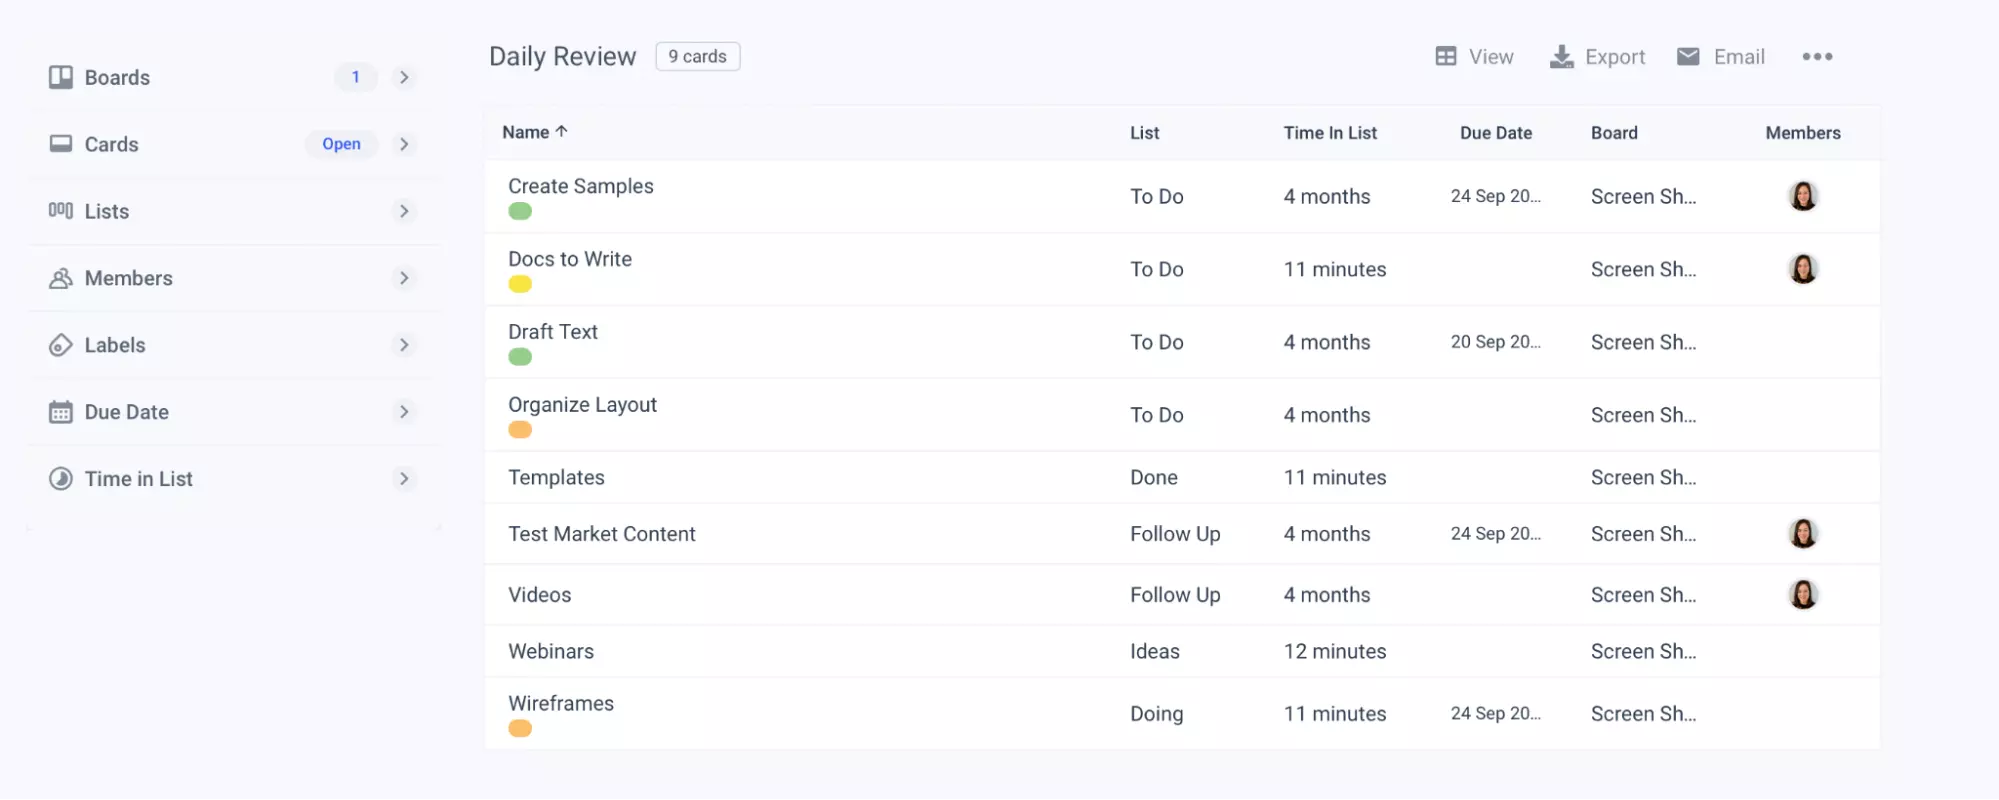
- Use the List filter to select the Lists you want to show Cards from.
- Use the Member filter to select Cards assigned to specific members.
- If you use Labels to organize Cards, you can choose the Labels that are most relevant to you from the Label filter.
- From the Due/Start Date filters, you can select Cards based on their due or start dates.
- Using the Time in List filter, you can select Cards that have been in your List longer than a specific period.
- If you’re using Custom Fields you should see your custom fields here with the option to filter your Cards based on those fields. If you aren't using custom fields, check out our custom fields guide to understand why and how you should!
And there you have it! Your very first Blue Cat Report daily quick List, ready to be exported or emailed to your colleagues. Quick Lists are a stellar way of keeping everyone on the same page on what needs to get done or what’s being delayed due to blockers, and organise their work accordingly.
Once you have created your quick list, click on the Email button in the top right to schedule your email report. You can set this to daily, weekly, monthly or etc. You will be automatically subscribed to the emails and can add any other email addresses in you want.
Once you have created your quick list, click on the Email button in the top right to schedule your email report. You can set this to daily, weekly, monthly or etc. You will be automatically subscribed to the emails and can add any other email addresses in you want.
These email reports are a great way to get a list of cards someone needs to take action on every day. You can even send it to people who aren't Trello users. Here are some of the most popular ways to use these reports
- Getting a list of cards due this week (or already overdue)
- Getting a list of new leads for a sales team to contact that day
- Getting a list of cards which have spent too long in a specific list
- Getting a list of open bugs (I use this daily so I can see what open bugs we have without having to open Trello)
- Getting a list showing open orders and where they are in the process for sales team members who aren't Trello users
More complex email reports - I want charts!
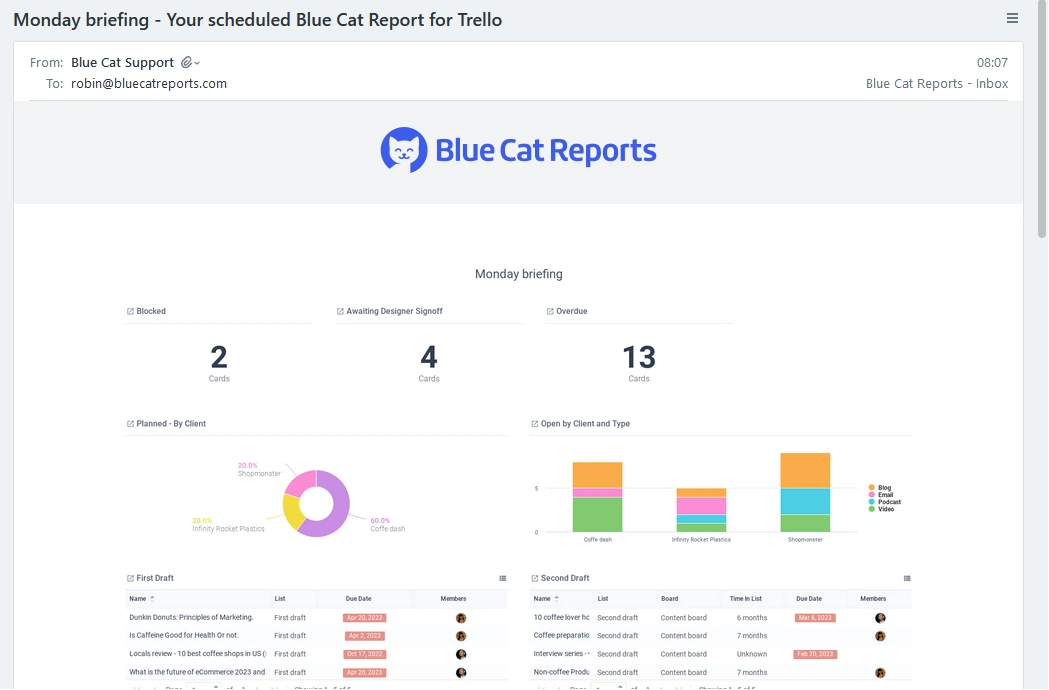
If you need something a bit more in depth than just a list of cards we move onto the second way to create email reports with Blue Cat Reports. For this we will create a report with multiple charts on it and set an email schedule on that. Our video demo showing the key features of Blue Cat Reports shows the sort of reports you can build.
Here are the steps to create your first Blue Cat report:
- First, make sure you have the Blue Cat Reports Power-Up installed and then click on it.
- Select the “Create a Report” button and name your report.
- You will be prompted to add multiple charts arranged in rows to a blank report.
- Select “Add a chart” and choose which chart type you want to add first
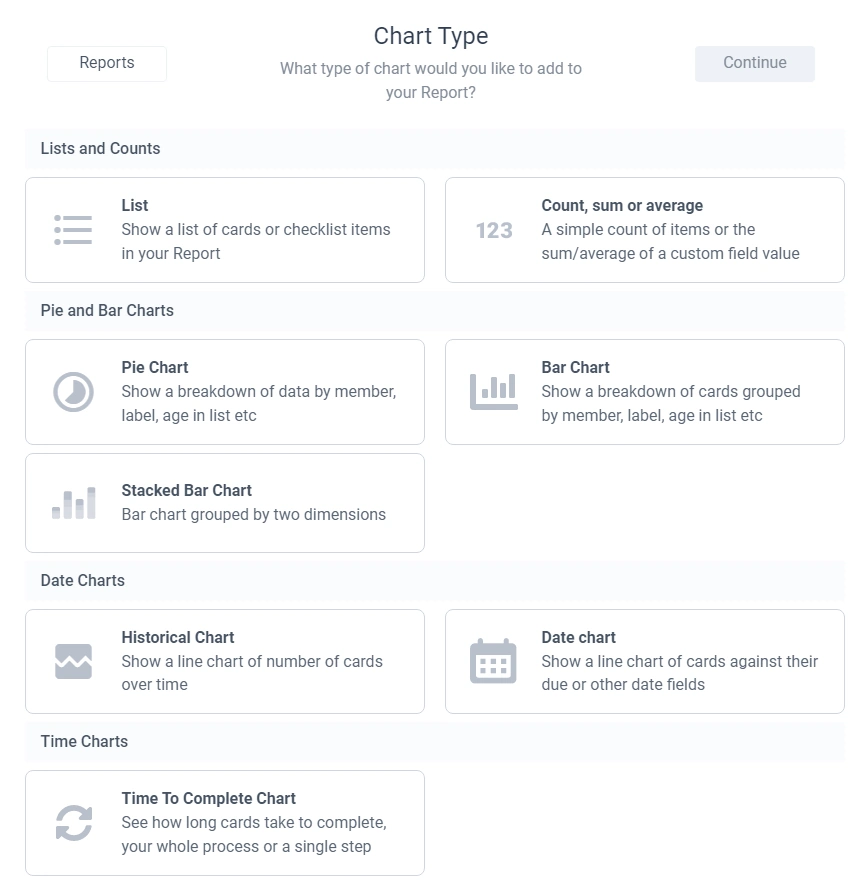
- Decide on how much space each chard should take in your report.
- Next, decide on the Cards you want to display:
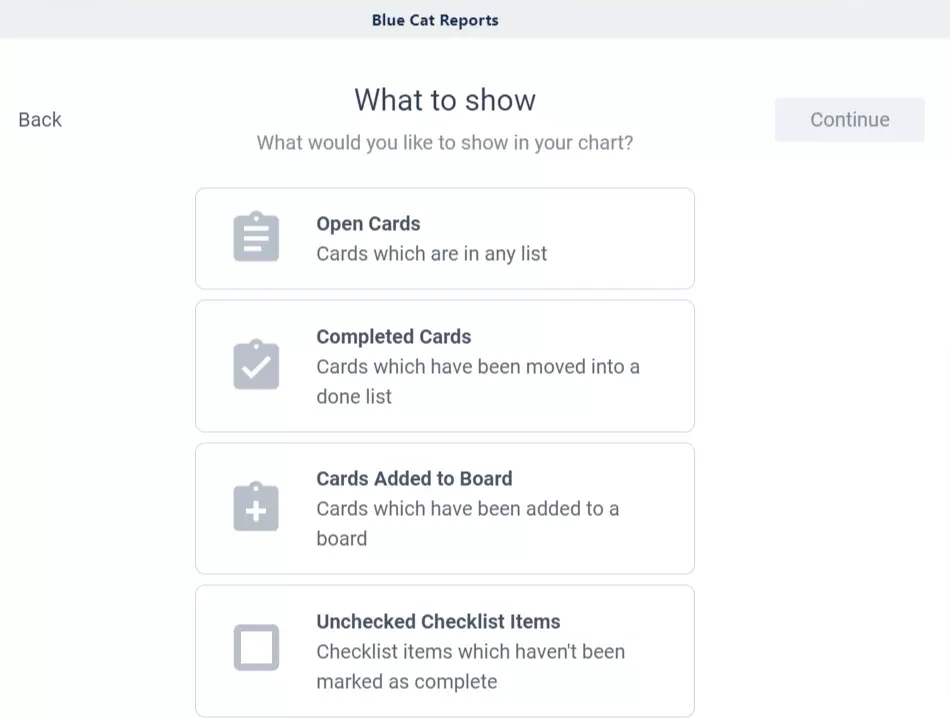
- Open Cards - Cards visible to your Board, including completed Cards.
- Completed Cards - Cards moved to the “Done” List.
- Cards Added to Board - All the Cards added to your Board.
- Unchecked Checklist Items - Checklist items that haven’t been marked as complete.
- Select the Board or Boards you would like to display the Cards from and hit Continue.
- Now you can choose whether to apply a filter or not. No filter will display all your Cards, while filter will display only the Cards filtered by Labels, Members, Lists, Due/Start date, Time in the List or any of your custom fields
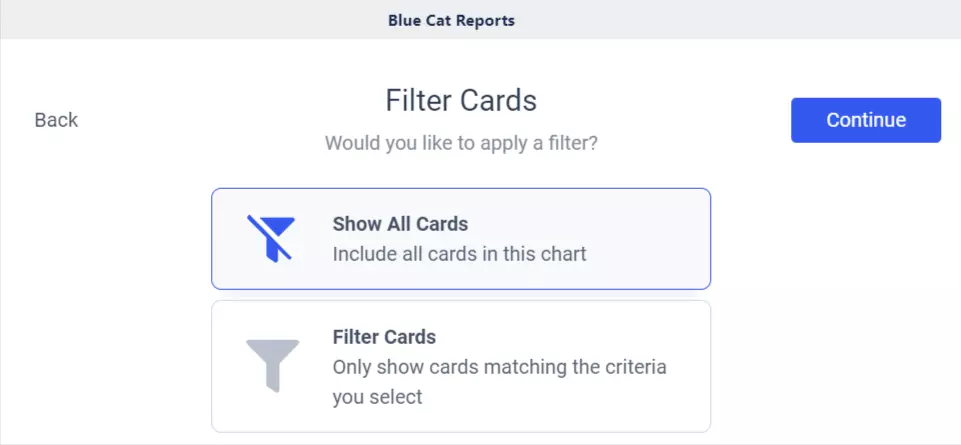
- Name your chart and hit Create.
- Your report is ready! You can now add more charts, drag and drop them anywhere you like within the dashboard, export your report as a PNG file, print it, or email it to your colleagues.
It doesn’t get easier than that! One of the most powerful aspects of proper reporting is that it removes possible mistakes and human errors that can cause delays to project completion.
Once you have built the report you want you can set that report to be emailed to you on a schedule by clicking the Email button in the top right. Again, you can send this report to any email address you like which can be a great way to get an overview of your Trello data for people who don't or won't log in to Trello
These email reports go beyond just a simple list of cards, they can be a great way to
- Get an overview of your work for a daily or weekly team meeting
- Get an overview of work for your boss or other stakeholders
- See an overview of your own workload and how it is growing over time
- See work completed over time as well as how work is distributed on your team
- Get an overview of a sales funnel or content pipeline for the team or stakeholders
Trello's built in Visual Reports
Trello provides visual email reports created via the Email Reports configurator available to teams on paid Trello plans. Essentially, they contain a visual representation of your selected Board's Cards that can be emailed to your team. They don't have the flexibility of Blue Cat Reports but if you are already paying for Trello and they satisfy your needs they could be the best solution. Here’s how to create your Trello visual email reports:
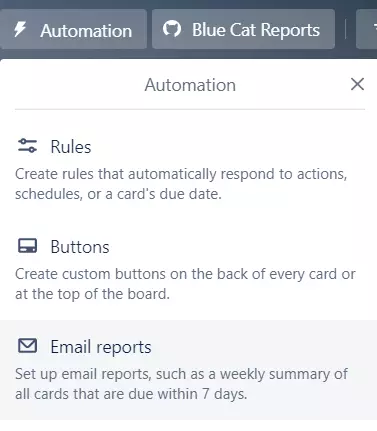
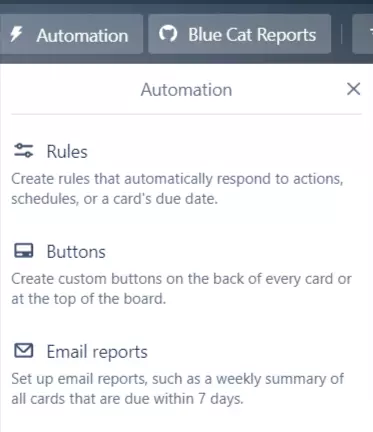
- Firstly, select the “Automation” button at the top of your Board and select “Email Reports”.
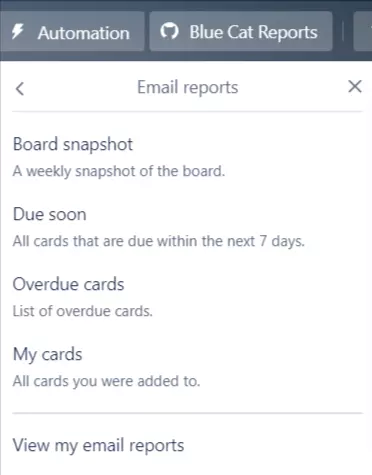
- You will be prompted to choose amongst 4 email report options: **"Board snapshot", "Due soon", "Overdue Cards",**or "My Cards".
- On the left menu, you can configure data such as the date and time to send the report, the email addresses of the recipients (up to 10), the email subject, and the message.
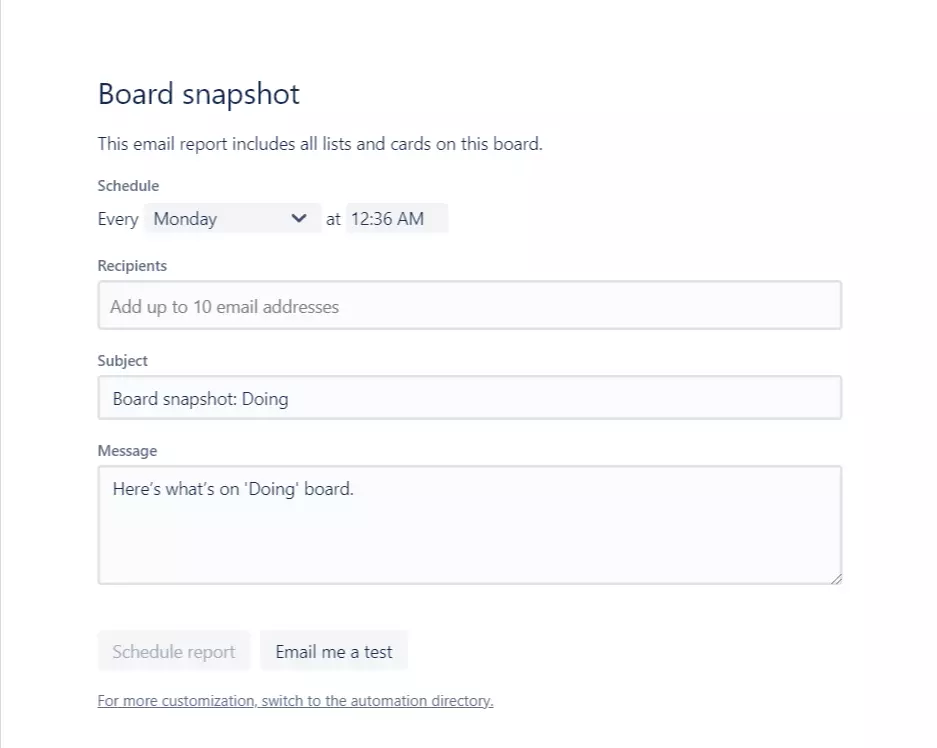
- On the right menu, you can see a preview of the email report.
- You get the option to send a test email if you want to check that everything works properly or schedule your email to be sent at your preferred date and time.
- If you want to view the email report command, you can navigate to the Automation directory’s Calendar tab.
Trello Text Reports
Trello text reports created via the Automation directory are focused on text, although they also offer the possibility of a visual representation of data. For example, you can choose a Board and ask the automation tool to group Cards and create a report with their content.
Let’s say that you want to be sending a daily report of all the completed Cards from your “Done” List to your team. You want to follow these steps:
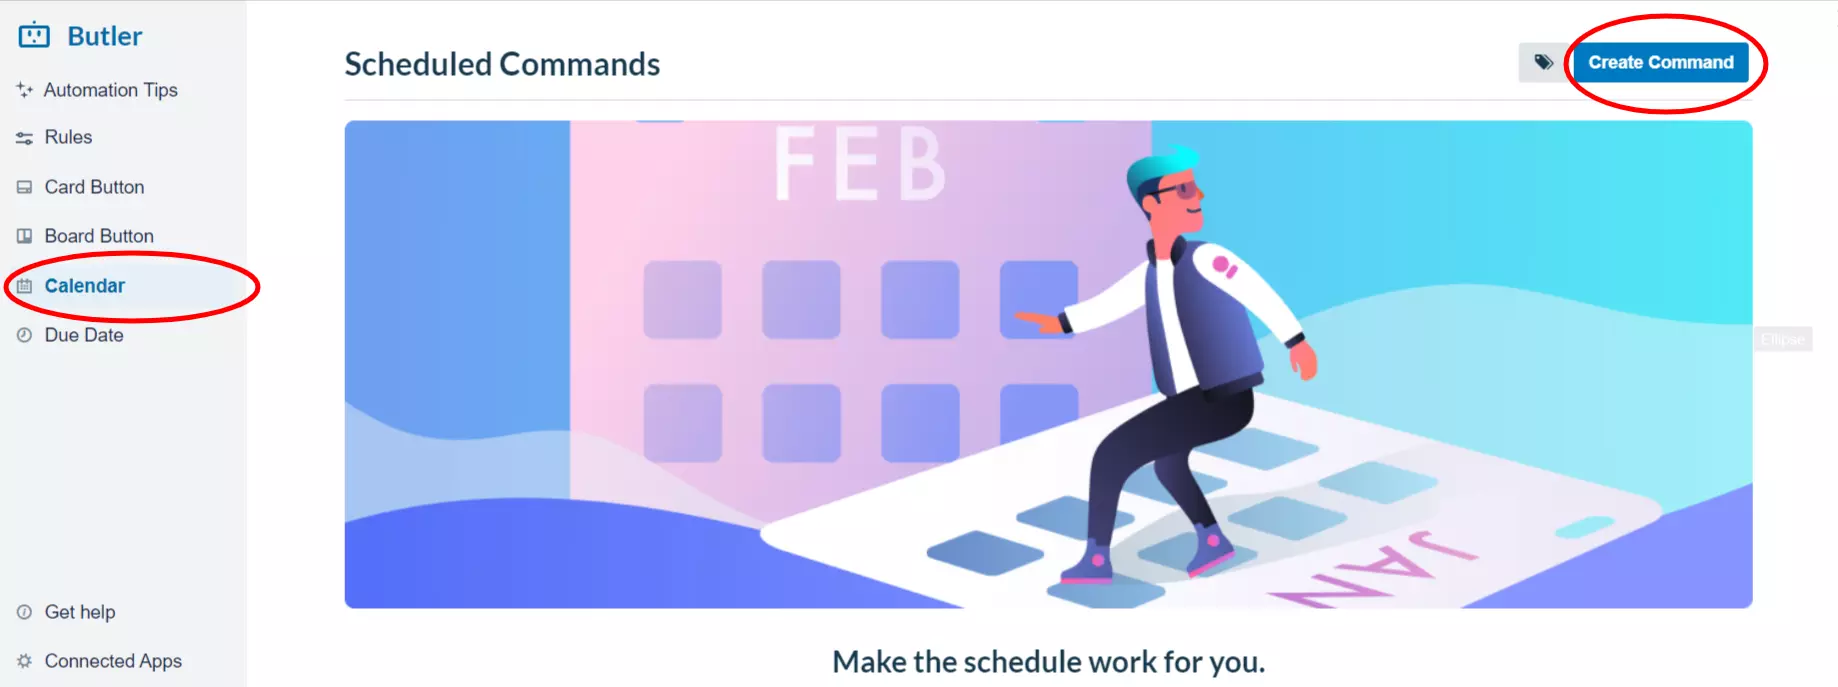
- First, go to the “Automation” option and select “Rules”.
- From the left menu, select “Calendar” and click on “Create Command” from the right menu.
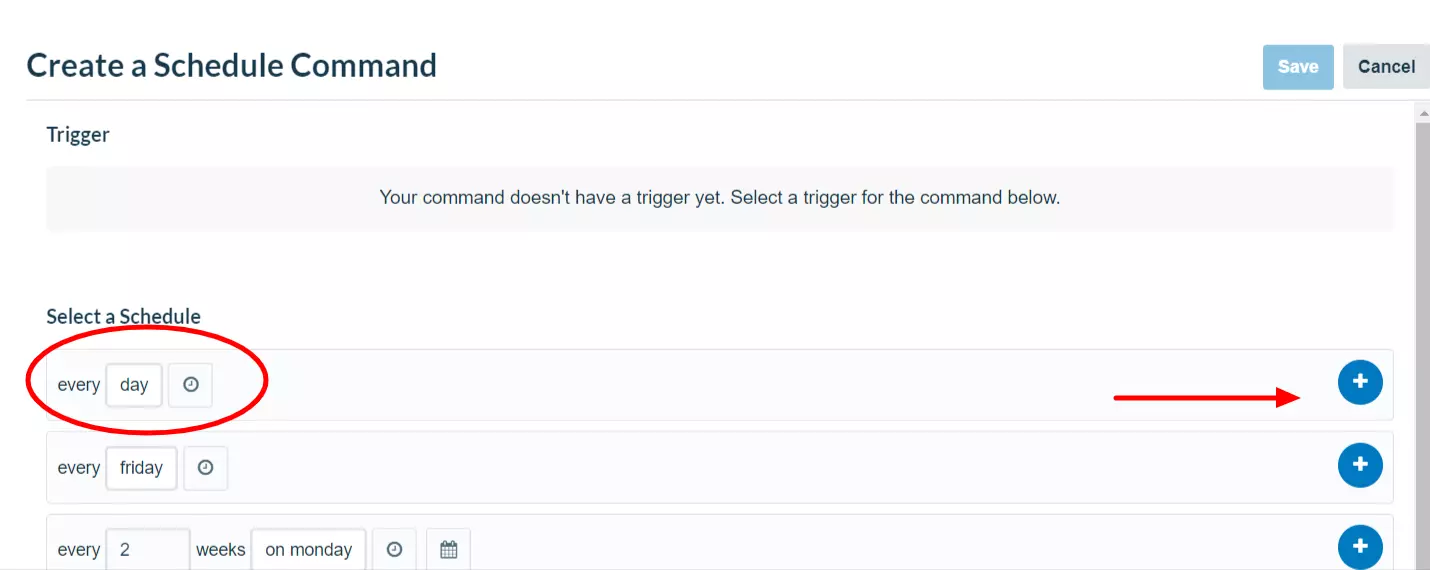
- You will be prompted to “Add Trigger” which will fire your command.

- Choose your preferred day and time - for our example, we’ll be selecting “every day” - and hit the “plus” button.
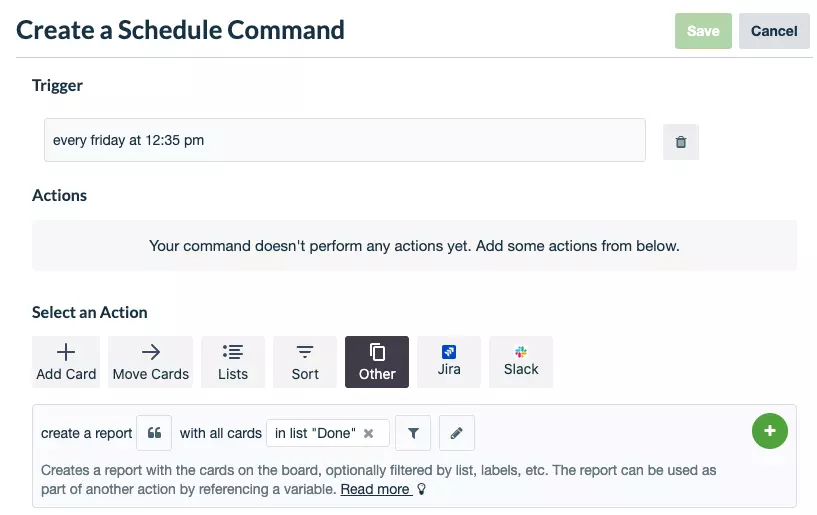
- Your command will now require you to set an Action. Go to the “Other” tab and click on the quotes to change the name of your variable.
 Source: Trello
 - Next, select the filter icon and choose the List “Done” to display its Cards.
- You can now go ahead and fill in your email’s subject and message. Your command should look like this:
every day,
create a report with all cards in list "Done",
and send an email notification to every member of the board
with subject "Daily Report for week {dateshort}"
and message "{$report}"
The variable {dateshort} will be replaced with the current date and the variable {$report} will be replaced with the contents of the report. If you opt for a visual report, you should use the variable {$report_html}.
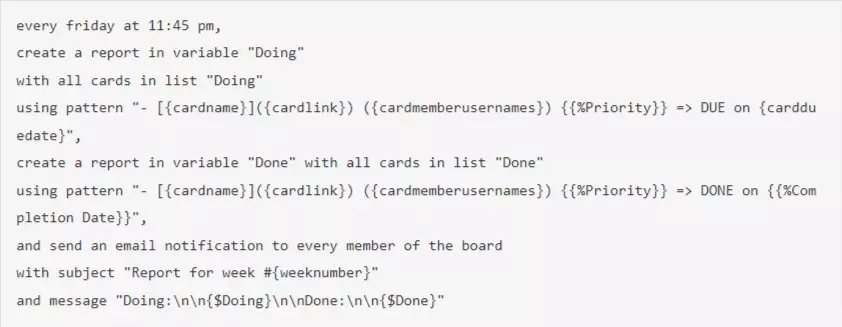
To further customize your reports or use multiple commands, you’ll need to specify your “using pattern”. An example of using multiple reports in one command might look like this:
 Source: Trello
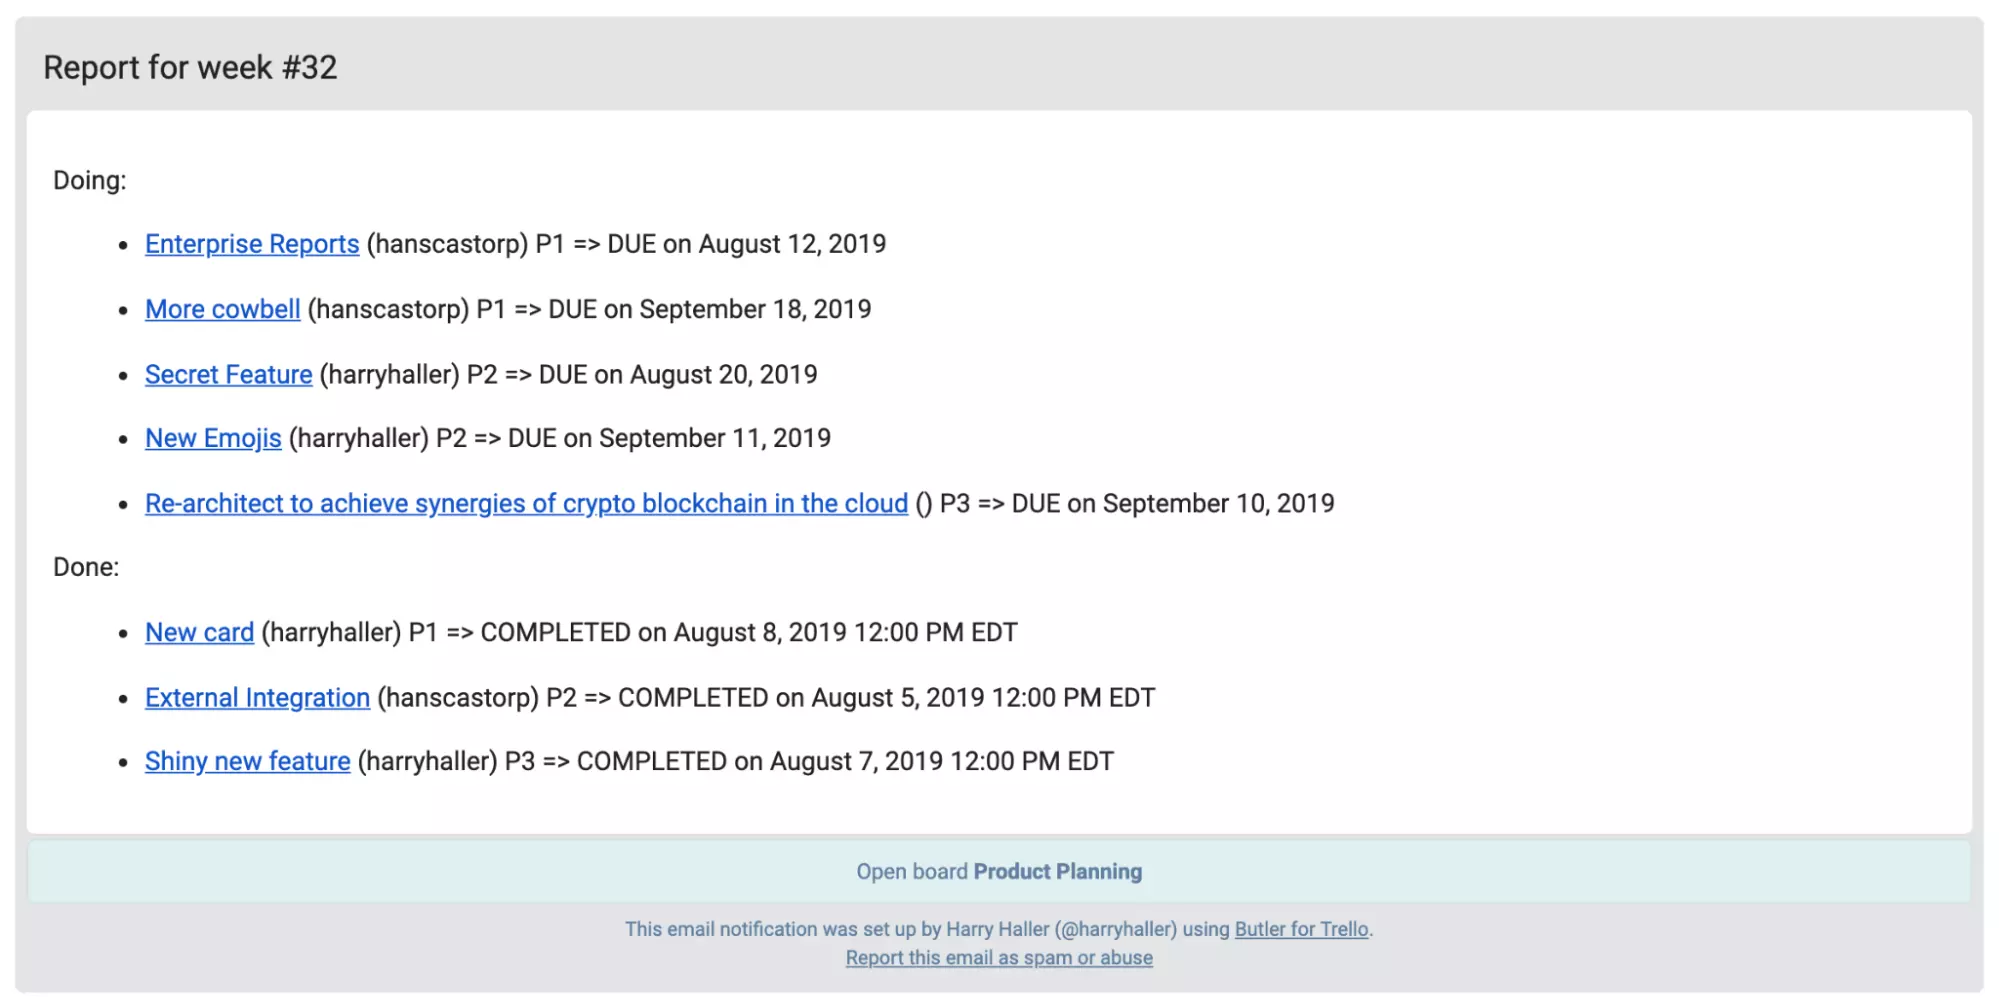
There are sequences, variables, custom fields, even ASCII character limitations you need to take into consideration. The final email report you can expect looks something like this:
 Source: Trello
Final Thoughts
Data visualization and reporting are vital when measuring a business’s performance and efficiency. Using Trello effectively to generate daily reports is one way of overseeing data and sharing them with your team. However, unless you’re familiar with the automation tool and rule setting, Trello’s reports can be tricky to set up and follow through.
Blue Cat Reports offers an easy to use alternative to visualizing data just one click away. It gives you the bigger picture of your efforts and makes customization fun! The easy-to-use editor lets you pull data from any Board and share the status of your projects in real-time with your team. So, if you’re looking to understand and improve your workflow without losing time on variables, start a free trial today and see for yourself!