Sales Opportunity Score
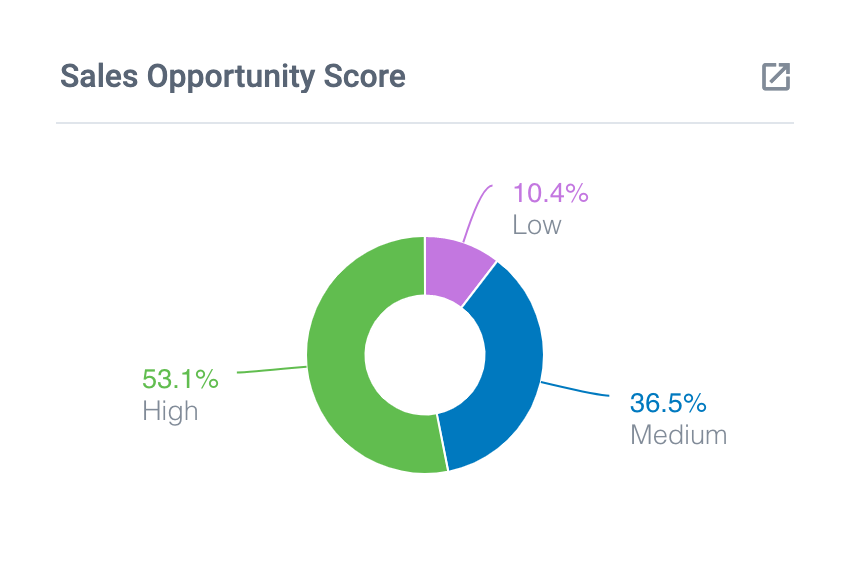
This chart will show you the breakdown of your sales lead potential - or Sales Opportunity Score. This can be helpful to identify the distribution of your prospects in terms of potential for sales. If you have too many "low potential" prospects, you can use this as a sign that you need to change gears or redirect your efforts toward more "high potential" customers.
This chart assumes you are using a dropdown custom field to identify your lead potential for each prospect. See Sales Teams Recommendations.
To get started, create a Bar or Pie Chart for open Cards.
- At the "Data Breakdown" step, you would select the custom field dropdown "Opportunity Score".
- At the "Totals" stage you would select Cards.
You can further break this chart down to show the lead potential within each prospect category - either Warm or Hot. You would need to create a separate one of these charts for each category.
- At the "Filter" stage, you would apply a filter for the custom field dropdown "Prospect Category" - in this case either Warm or Hot.


