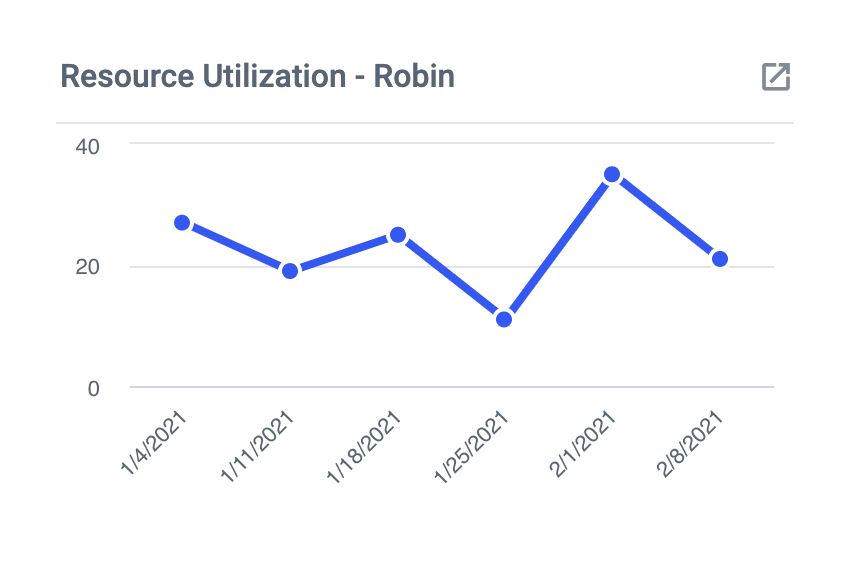
Resource Utilization Over Time
This chart will show you how your workload is being distributed across your team members over time.
To get started, create a Historical Chart for completed Cards.
- At the "Totals" stage, here you will select the following:
- Cards - this will show you total completed cards for each team member
- At the "Filter" stage you will apply a filter for Member. Then you will select which Member you would like to see data for.
You will need to create a separate one of these charts for each member of your team.


