Project Tracking Guide
Project tracking consists of monitoring metrics, tasks and progress against targets previously identified in the project plan.
Project tracking helps everyone involved in your project understand how the project is performing compared to the project plan. It clearly displays all work completed, resources used, and any project variance.
You can use project management software like Trello alongside power ups like Blue Cat Reports to get all your data in one place and create easy to use reports.
Tracking project progress is a sure-fire way to stay on the right side of your stakeholders and keep up with your teams but let’s take a deep dive into the anatomy of great project tracking.
Why project tracking is essential
Project tracking allows you to monitor deviations in actual performance compared to the estimates forecasted in the project plan.
Well planned, effective project tracking highlights issues in their early stages, helping you to take corrective action before it’s too late.
Scheduling
Analysing your progress with a top-level view of all your teams, tasks and sprints helps you ascertain if your project is still within time tolerances. You can predict deviations in advance and take corrective action to ensure your project stays on track.
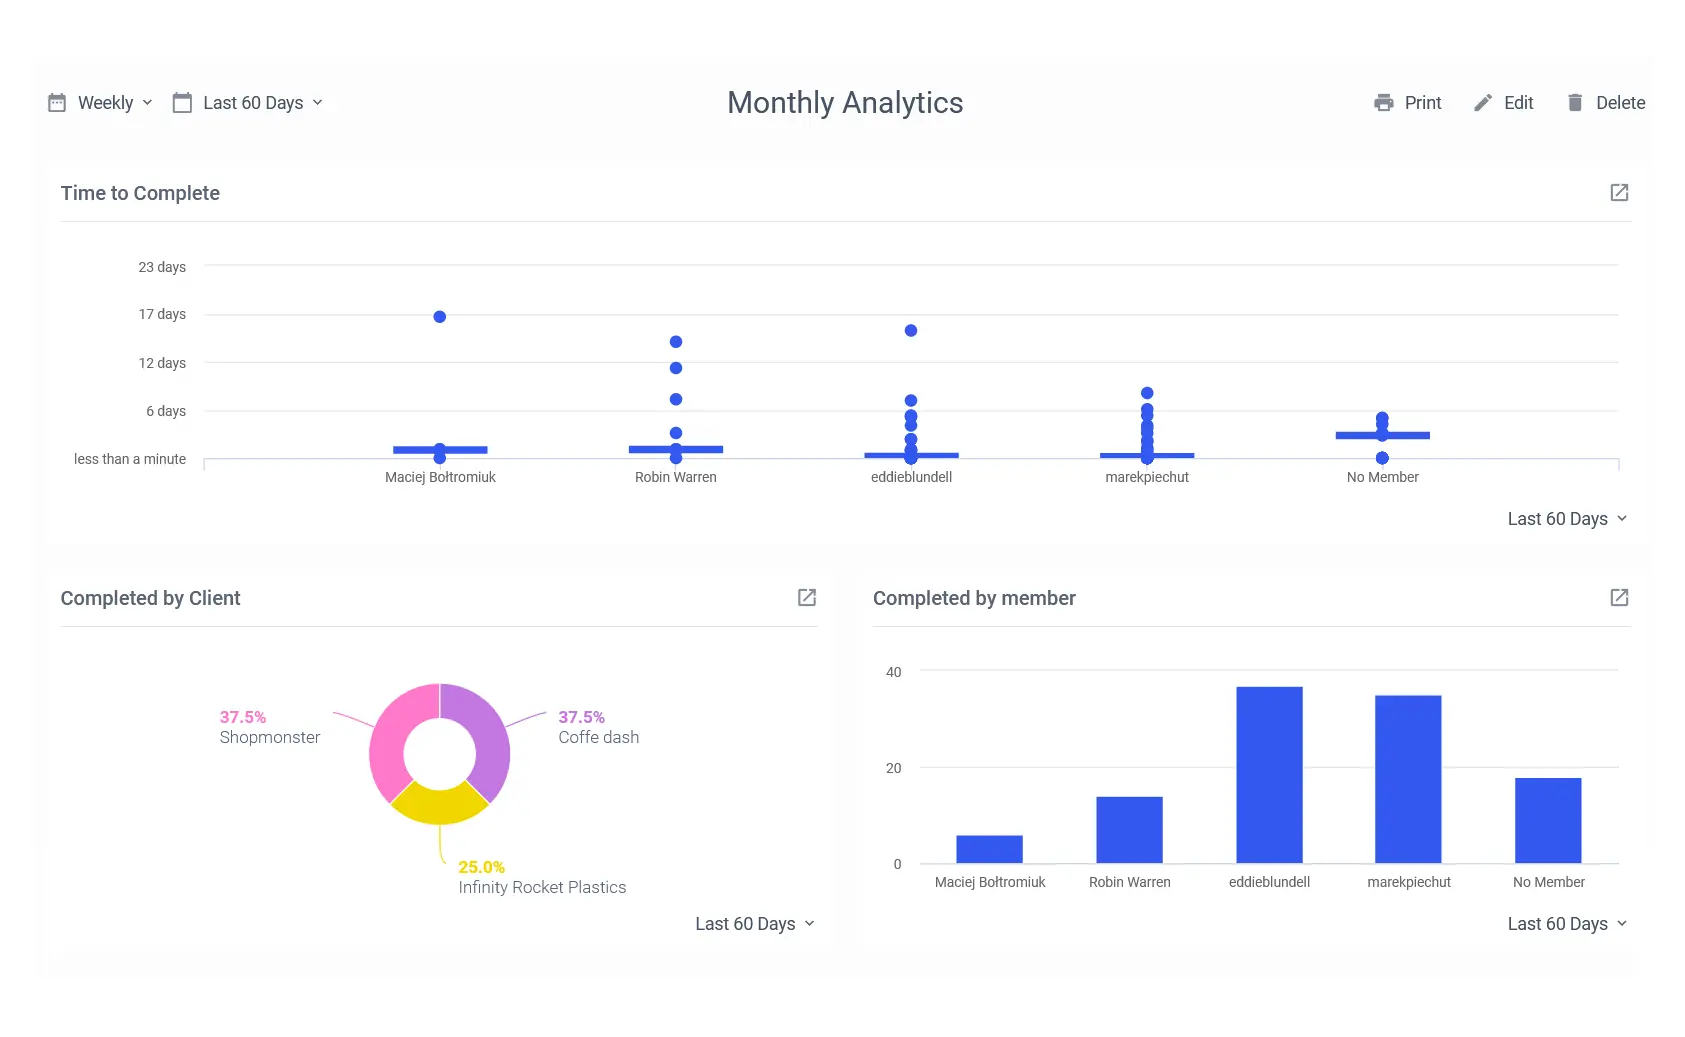
You can and should track progress on a daily, weekly or monthly basis. Using a tool like Blue Cat Reports allows you to create summary reports with ease, you can display data in quick, digestible charts that show progress and performance over time.

The key takeaway here is clear, concise data, displayed in an easy to understand format that you, your team and your stakeholders can understand and take action.
Budget
Budget planning and tracking are paramount to successful project management. Running over budget is normally the result of poor or inadequate project tracking.
Budget issues plague large scale projects where monitoring costs and spending across large workforces can be neglected.
Let’s take the construction industry as an example. According to a study published in 2017 which spanned twenty countries and 70 years, 85% of all projects completed experienced cost overruns.
Tracking your costs on a daily basis can help you identify overspending immediately and correct it so you can avoid joining the above statistic.
We’ll go over some methods to calculate if your project is running over budget later on.
Staff and resources
Using the right team or individual for the job will save you resources, budget and time. Maintaining a top-level view of each of your teams, their tasks and workloads will help you prioritise your staff and resources.
Let’s take social media scheduling as an example. You require 20 posts to be scheduled for publishing next week. This requires the use of an online platform and data entry skills.
Employee A has no data entry skills and has never used the scheduling platform.
Employee B has data entry skills and has used the scheduling platform previously.
By utilising Employee B’s skill set the task will be completed within both time and budget constraints.
Employee A would need to familiarise themselves with the platform before starting the allocated task, likely leading to overruns in time and cost.
Use project tracking to understand your teams and their workload. Try to keep your tasks matched with the right skills and you’ll reap the benefits.
Tracking project progress
Effectively tracking project progress requires communication across your teams and is more than solely data. How and when you communicate will be dictated by your project plan but some of the most common approaches are:
Meeting with your project teams
These can be in person or via video call and should be an opportunity to get feedback on how your team feels their tasks are progressing.
Try to encourage your team to identify any barriers to their performance and highlight any future issues.
Get valuable information from your teams on the front line that can help you reduce risk throughout the lifespan of the project.
Individual meetings
One to one meetings with your team members can be time-consuming but are a valuable tool and help build trust in you as a leader.
Meeting individually is an opportunity for members of your team to raise concerns that they may not feel comfortable raising in front of their fellow staff. This is particularly true when an individual's view on progress and performance does not align with the general consensus.
Task progress
Timely updates on task progress via your chosen platform is key to understanding your project’s performance.
Encourage all your teams to promptly update any tasks that have been completed, raise any issues or concerns and record costs and spending on a regular basis.
Receiving and compiling this data as soon as possible will make sure you stay ahead of any time or budget constraints and identify potentially unforeseen risks as the project progresses.
Measuring efficiency
Recording how long members of your teams spent completing their allocated tasks is central to optimising the staff and resources we detailed earlier. This is especially true for remote teams, where people are evaluated based on their performance over time.
You can calculate hourly rates and skill sets to ensure every task is handled by the most efficient and qualified team member and accurately estimate cost. Use our reporting tool to estimate project velocity through various metrics, such as how long a task has been on the list.

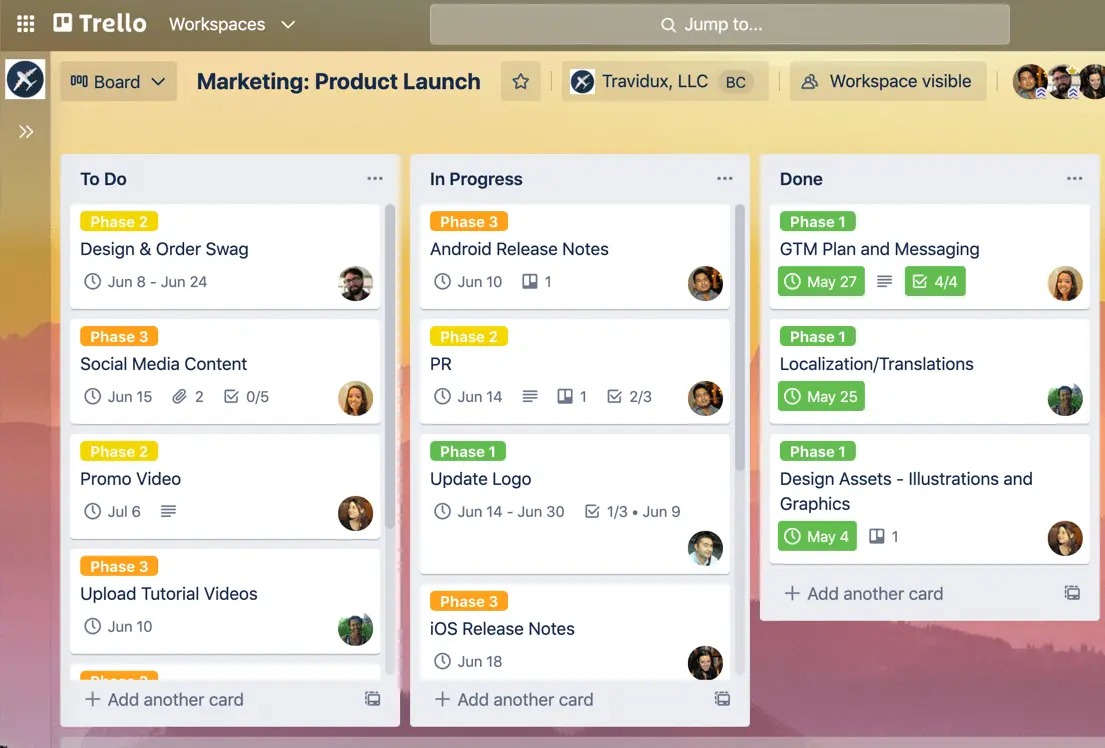
Example of monitoring task progress in Trello
Project status reports
Project tracking should be a constant alongside your other day to day activities but project status reports offer an opportunity to draw conclusions from your data and accurately communicate them to your team and stakeholders.
Reports can be delivered daily, weekly or monthly based on the attendee’s requirements and the project plan. Creating and analysing your project status reports is an opportunity to record your findings in a structured format.
This typically takes the form of a PDF or PowerPoint presentation including short observations on project health and performance curated for the audience followed by data to reinforce the observations.
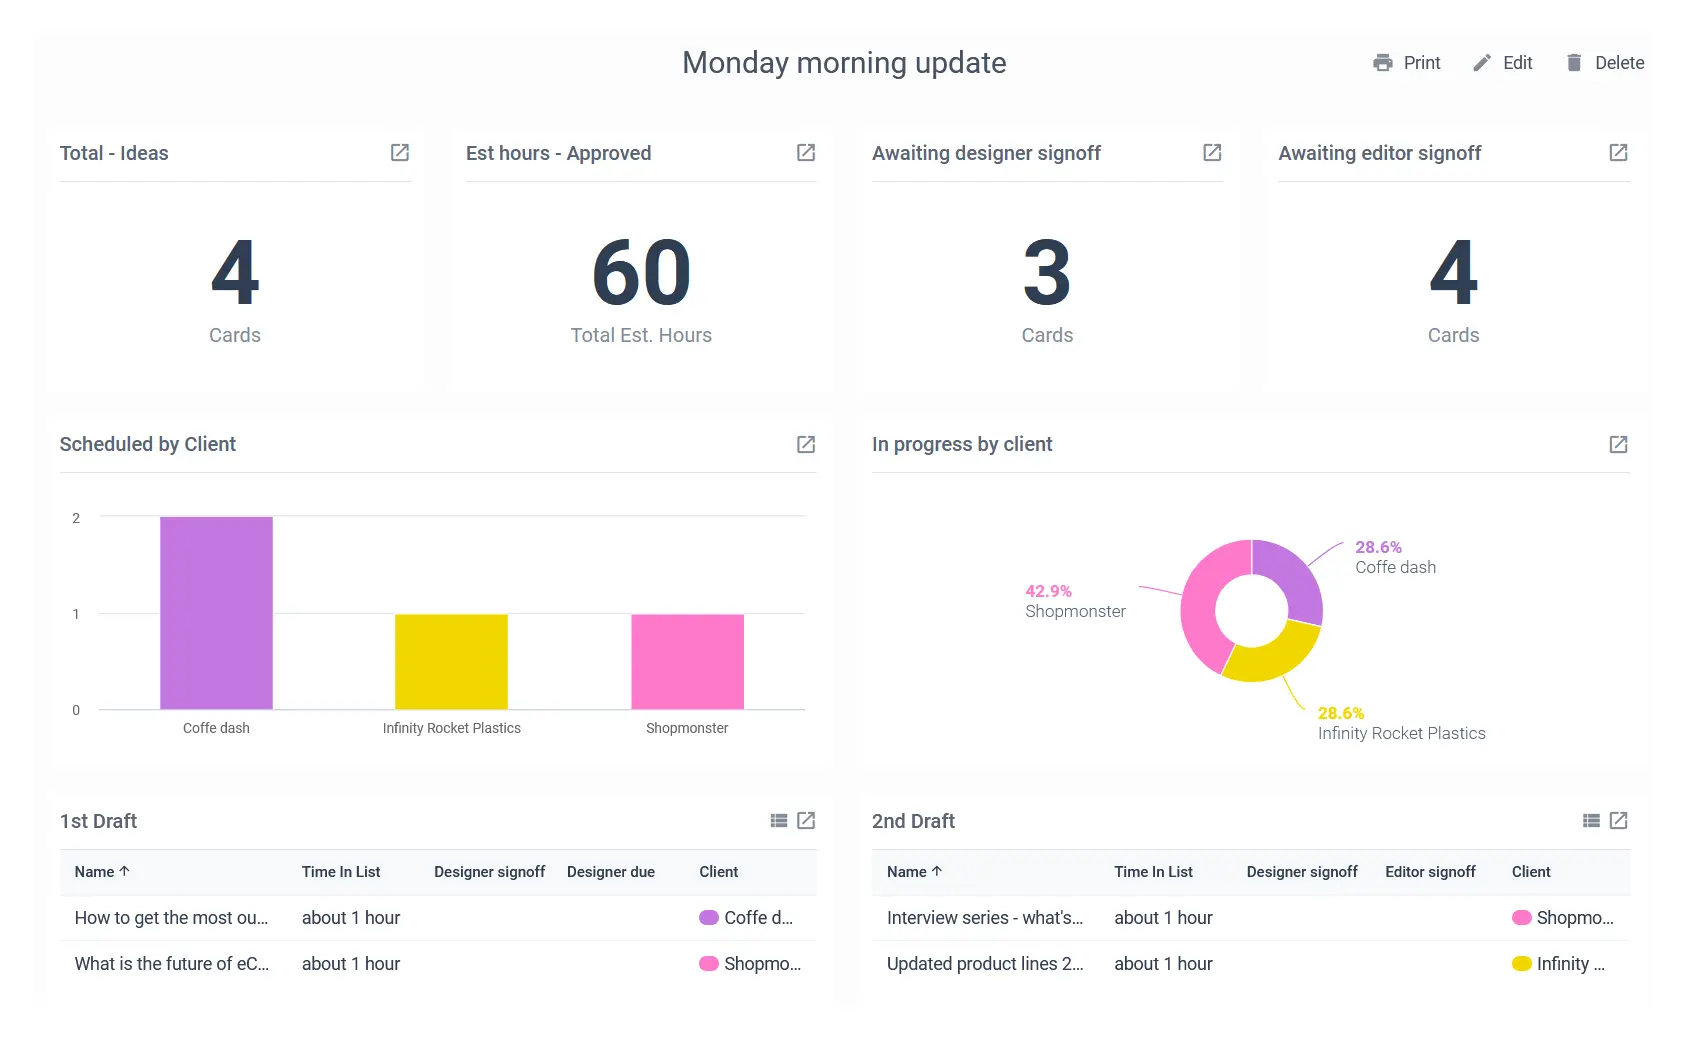
You can use project management platforms like Trello alongside power-ups like Reports by Blue Cat to create easy to understand tables and charts across multiple boards for your reports.

Example of quick digestible charts and tables produced by Blue Cat Reports
The need to know data for project tracking
How you decide to track your project's performance is up to you but the methods and metrics below provide you with all of the key information you need to analyse your project's health and performance. Using an analytics tool like hours allows you to automatically measure and easily gather insights from these types of data.
Task completion - This simple metric gives you an overview of your project and if it is within time tolerances. Are tasks being completed within predicted timeframes, how is each team performing against your forecasted achievements.
Look for consistently poor performance across teams or individuals and organise team meetings or one to one to try and ascertain the cause.
Milestones - Milestones are predetermined moments in the lifespan of the project. This could be the start or end of new phases in the project plan or important client approvals that are required for the project to continue.
Percentage completed - If you’re using project management software you can assess your tasks, teams and project as a percentage. This is a fantastic snapshot metric to get a macro view of what’s going on within a project.
It can be hard to determine any conclusion from percentage alone and will generally need more investigation and analysis of additional data or feedback from team members to identify issues.
Earned value (EV) - Earned value measures how much progress has been made compared to the project plan. To calculate the EV for your project you can simply multiply the percentage completed by the total project budget.
If your total project budget is £100,000 and you are currently 65% of the way through the project your EV is £65,000.
This metric alone has little value but when utilised alongside some of the metrics detailed below it can highlight vital information about your project.
Planned value (PV) - Planned value is how much progress you predicted to make at any given stage. This should be detailed in the project plan before the commencement of the project.
Schedule variance (SV) - SV relates to how actual progress relates to planned progress. Projects behind predicted performance in the project plan will have a negative SV, and projects ahead of predicted performance will have a positive SV.
To calculate SV you simply minus your PV from your EV.
If your project PV at this stage is £75,000 and your EV is £85,000 your SV would be +£10,000.
Positive numbers indicate your project is ahead of the planned performance and negative numbers indicate the opposite.
Cost variance (CV)- CV is the difference between the costs budgeted and actual costs to date.
To calculate CV minus the project's actual costs from your EV.
In our example, the EV for the project is £65,000 but AC (actual costs) are £75,000, in this case, the CV is -£10,000.
This shows the project is over budget, with negative indicating overspending,
Schedule performance index (SPI) - SPI shows if a project is ahead or behind the schedule set out in the project plan.
To calculate your project’s SPI, divide your EV by your PV.
The extent and regularity at which you use these metrics will depend on your project but they all provide a quick actionable way to track project progress.
Project tracking highlights issues in the health of your project, your role as a project manager is to quickly identify how to correct any deviations away from your plan. Always stay reactive and use careful project tracking as an early warning signal for your next project.


