What is a Cumulative Flow Diagram (CFD)?
A Cumulative flow diagram shows how many cards were in each list at the end of each day, and how many cards have been completed over time.

Let's take a look at how you can make the best use of this chart in your Scrum or Kanban team ☺️
How to use your CFD
There are a few things people look for in their CFD charts.
- Is WIP (Work In Progress) building up over time?
- Is the Backlog building up over time?
- Is work in any individual lists building up over time?
- Is work getting done at a constant rate?
Is WIP (Work In Progress) building up over time?
Hide the Completed and Backlog cards on your CFD. If you are using Corrello you can click in the legend to hide the done and backlog lists and show just the WIP.
Here we can see WIP building up over time. This means the team is starting new work before finishing their previous work.
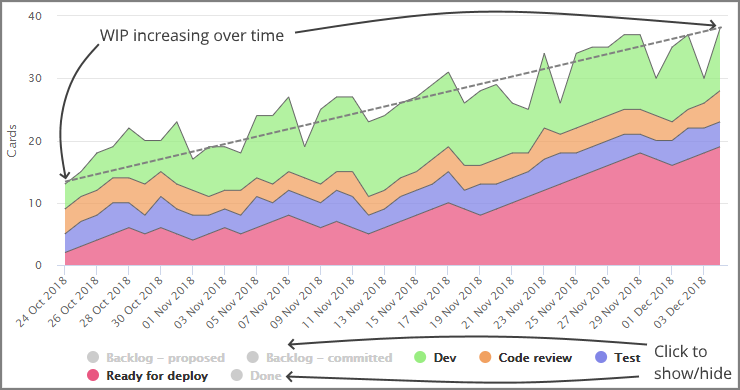
WIP building up over time means work will be getting completed slower as more things are being worked on in parallel. It will also mean more context switching between tasks which can reduce the teams effectiveness.
If you are reviewing the CFD for a retrospective it may be interesting to ask if the team noticed anything about how they were working when WIP was increasing? Perhaps that matched a time they were under pressure to take on urgent work? Or were they blocked on many of their tasks?
If you are reviewing the CFD during a daily standup it may be interesting to ask the team if there are cards they can focus on getting completed today before adding more tasks? Check out the Slow Cards view in Corrello to see cards which have been in progress for a long time
If the team benefits from tracking WIP you could enable WIP limits in Trello using the (Free) Agile Tools power-up.
Is the Backlog building up over time?
Similar to tracking if WIP is growing, hide all but the backlog lists on your CFD.
Here we see a team where the backlog of work is growing faster than they are tackling it.
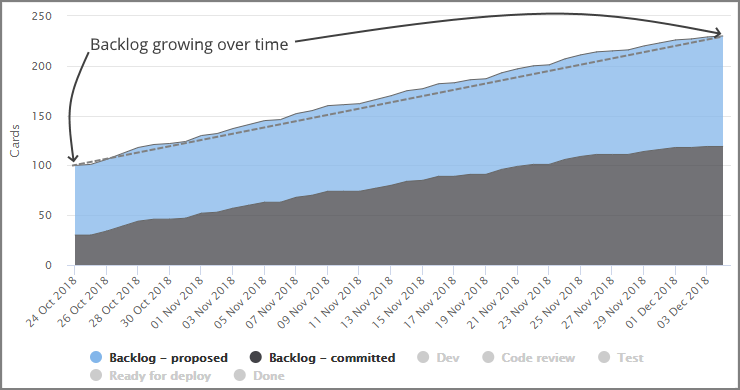
The risk here is that the team is committing to work faster than they can deliver it. Over time people outside the team will start to notice that work the team commits to takes longer and longer to get done, as it must wait for more other cards to be completed before it even gets started.
It may be an idea to work with those who generate the work for the team to make sure they understand this, or even hold off on committing more work to the team.
Is work in any individual lists building up over time?
Check if work is building up in any one list.
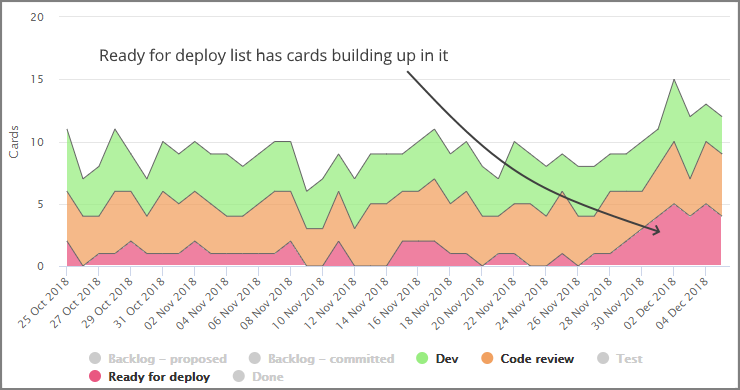
This may indicate a bottleneck developing at one point in the process. For example if you have a 'testing' list which has cards building up in it for the last week there is almost certainly a lack of resources for testing, or something blocking work at that point.
It would be good to look at that with the team and see if more people need to help with testing to get cards moving or if some blocker needs to be removed.
Also, are there steps downstream from the current bottleneck which will struggle to deal with the number of cards arriving when they all actually get done?
Is work getting done at a constant rate?
Ideally your CFD looks like a series of roughly parallel lines. This indicates that work enters and leaves each list at the same rate. However it isn't uncommon to see a 'saw tooth' pattern with cards building up in one list then all moving on to the next step.
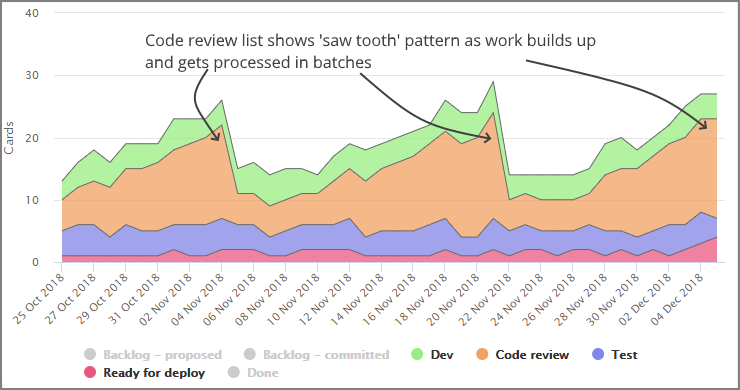
While this may not be a problem it can often indicate that some steps of the process aren't being actioned as fast as they could be. A typical example is a 'Review' step which someone checks every day or two. Cards build up there and then get moved on when someone takes the time to review them.
This can be a problem if those cards need more work and are sent back in the process. Someone will have already started on their next task. They now need to context switch back to the previous task. If that review is done asap once the card is initially done it is easier for them to fix any issues.
In conclusion...
So there we have it. What is a Cumulative Flow Diagram? And how you can use it in your daily standups and your retrospectives to help your team improve!
If your team is using Trello and would like a CFD automatically built for them, check out the free trial for Corrello - Dashboards for Scrum and Kanban teams using Trello.