How to add charts to Trello
Trello is great, but as a project management tool it can be a little bare bones. In this post we'll look at a few ways you can add some different charts in to your Trello boards. The simplest is to get some existing plugins and power-ups to do the job for you. The next option is to use the API to add some totally custom charts that you can configure however you want (assuming you've the skills and the time).
UPDATE: If you are looking to generate your own simple charts from Trello we would now recommend checking out Blue Cat Reports. It is a simple yet powerful way to create reports for you Trello boards, projects and teams :)
Plugins and power ups to add charts to Trello
There are a bunch of different options here depending on your needs. We've got options for old school PMs looking for Gantt charts, agile teams looking for Burndown charts and Cumulative flow diagrams and for those of you who need to keep an eye on the time there's great options around time tracking too.
Gantt charts
I'll freely admit that Gantt charts are not my first port of call when looking to add charts to my projects. However, they serve a purpose and for some people they are the key chart that they need. The best place to get started adding Gantt charts to Trello is with a tool called Elegantt which works as a chrome plugin or a Trello power up
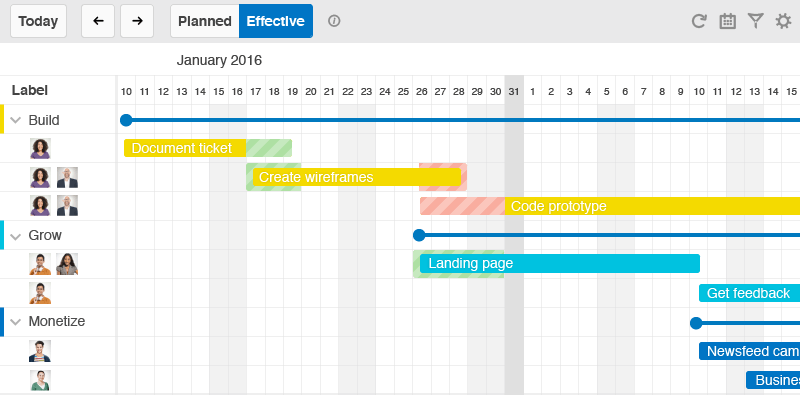
Elegantt also adds some nice features on top of Trello such as task dependencies and milestones (ie the date of an upcoming launch). If Gantt charts are your thing you should give it a go.
Scrum and Kanban charts
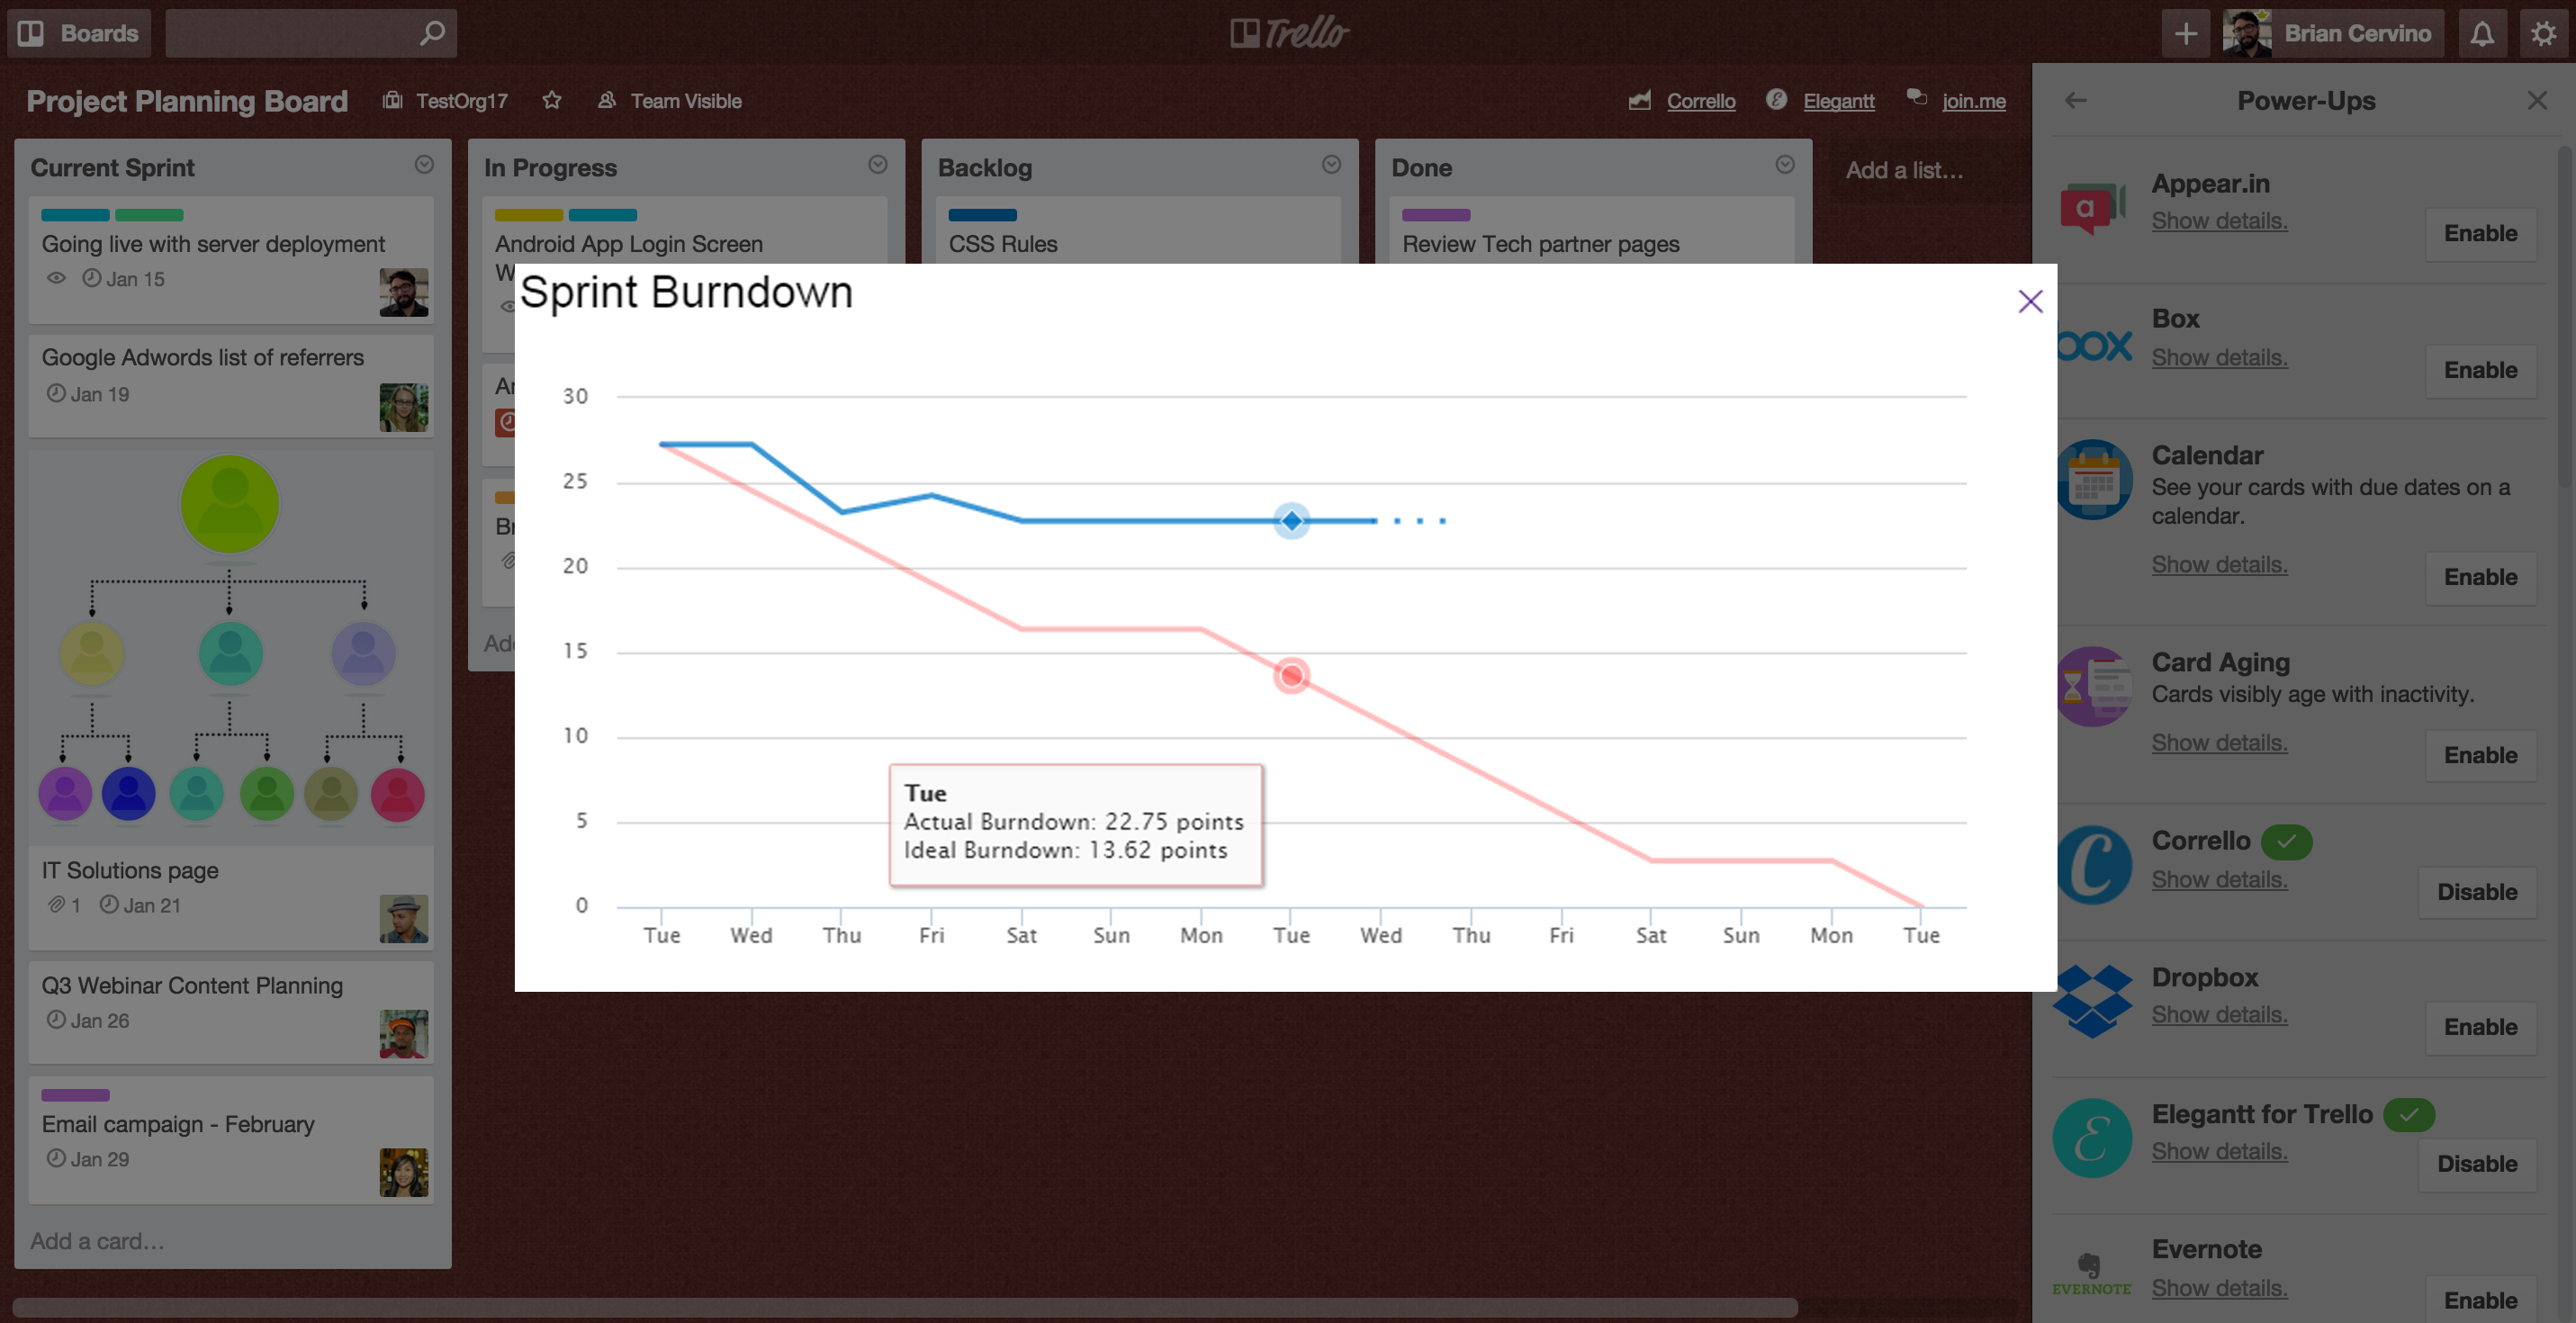
Naturally I would say this as I built it but if you're looking to add charts for agile teams the best option is Corrello. It has a mix of features for both Scrum and Kanban teams, so you can get your sprint Burndown charts for your Scrums:
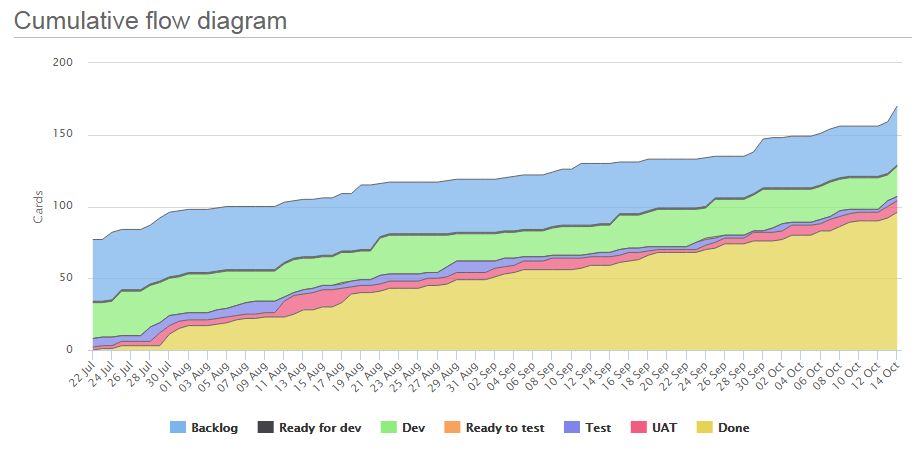
And for Kanban teams there's Cumulative flow diagrams:
As well as Cycle time charts (and cycle time percentile ranges):
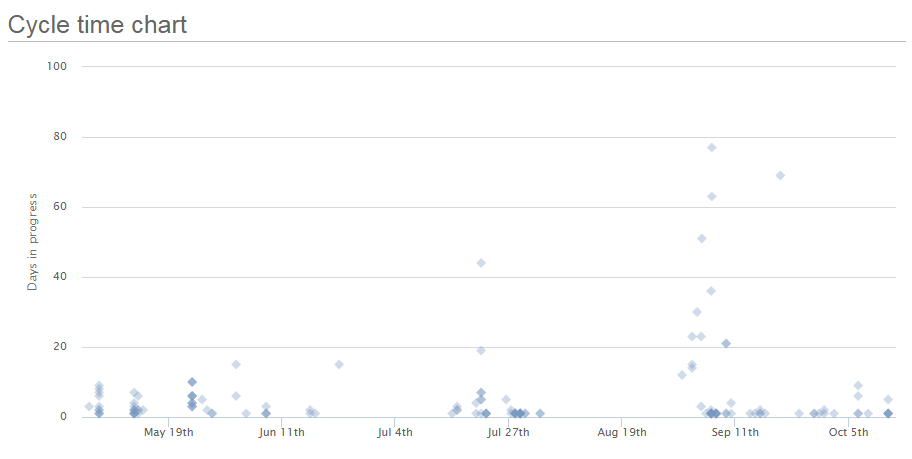
These and other charts are all available in Corrello, and for Trello business class users you can also install the Corrello power up to get the first two directly in your Trello boards.
The main alternatives to Corrello would be Burndown for Trello (here) for burndown charts and this site for CFD charts.
Time tracking charts
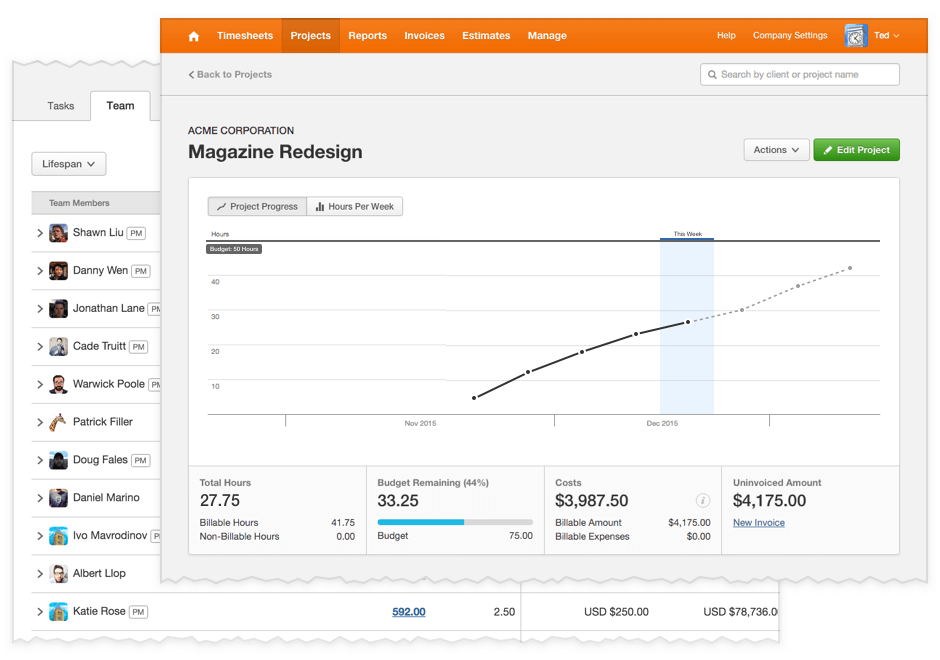
Harvest is a tool which gives you visual reporting to keep track of project progress and break down the hours that went into that project. It's a great looking tool with plugins for a lot of project management tools including Trello. With their Chrome plugin or Trello power-up you can start and stop progress on individual cards directly from Trello. You can then keep track of the time spent on projects and tasks in Harvest. If you're interested in tracking time spent and progress down to the hour against a time budget Harvest is a nice option.
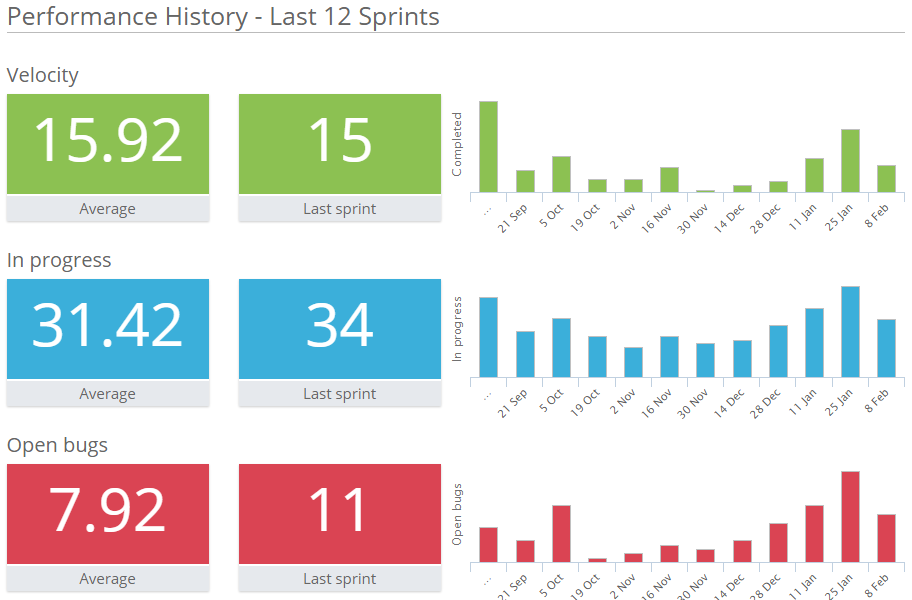
Simple charts (counts of labels, overdue cards etc)
Sometimes all you want to know is how much work you and your team mates are getting done each week, and a few other simple counts (cards labeled as 'bug' or past their due date). This would actually be one of the simplest to build your own dashboard for if you wanted to use the API. If you'd rather someone else do it I'm going to have to plug Corrello again I'm afraid.
Using the API to create custom charts
I've written a little about creating your own dashboards using the Trello API previously. That should serve as a good starting point to get to grips with the API and put together a quick POC for your charts. The next step is to pick your visualisation library. For simple charts I'd suggest HighCharts which is what I use for all the charts in Corrello, and if you need some more complex charts check out d3.js.
An alternative approach if you want to avoid coding everything up yourself is to pull the data into google sheets. There is a write up on that approach here. That still requires some coding but it saves you creating the charts yourself as once your code has pulled the Trello data into google sheets you just manipulate it and create your charts there.
That's it. My top picks for plugins again in case you wanted the links are